Who Else is
Measuring Salinity? |
Located at the same latitudes as the great deserts of Africa, the central North Atlantic is home to the saltiest waters in the open ocean.
Recent evidence shows that salinity in this area has been increasing in recent decades. The Salinity Processes in the Upper Ocean Regional
Study (SPURS) includes a series of expeditions to this "salt maximum" region, funded by NASA and international collaborators.
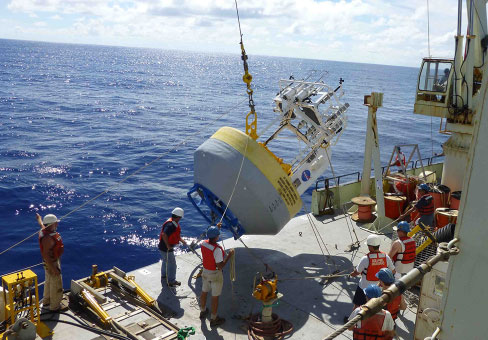
SPURS has employed a variety of tools - floats, gliders, drifters, moorings, ships, satellites, and
computer models - to help scientists understand the processes that are controlling upper-ocean salinity. Science objectives include
determining what processes maintain the salinity maximum and influence salinity variations over time, finding where the excess salt
goes, and examining the effects of salinity change on ocean circulation.
Like other ocean-observing satellite instruments, Aquarius detected surface seawater properties to depths of about 1 cm (~0.4 in). Given the
dynamic nature of Earth's seas, it is important to link Aquarius's "skin" measurements with other observations of the upper ocean. A key
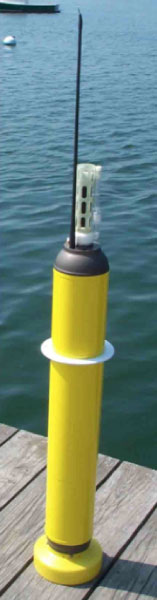
advance in this effort is a special series of Argo profiling floats developed at the University of
Washington, which are designed to acquire salinity and temperature in the upper 10 cm (~4 in) of the ocean. These enhanced floats help to
"close the gap" between Aquarius and conventional Argo floats whose shallowest data are acquired at a depth of 3-5 m (~10-16 ft). Currently,
only about 1% of more than 3,000 Argo floats in Earth's ocean have this enhanced capability. However, SPURS has demonstrated the promise of
using Aquarius and Argo together to improve our knowledge of how freshwater cycles between the atmosphere and the ocean.
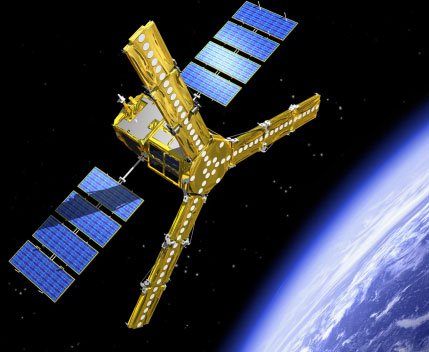
A key goal of the oceanographic community is to combine Aquarius measurements with European Space Agency's counterpart, the
Soil Moisture and Ocean Salinity (SMOS) satellite to produce
an even more accurate picture of ocean salinity. Launched in November 2009, the SMOS satellite collects ocean salinity data at the same
frequency as Aquarius, but uses a different technology: an interferometric technique in which the signal from many small antennas is used to
achieve the resolution of a large antenna. Despite the difference in technology, SMOS data are very complementary to Aquarius data. In fact,
early indications are that inter-comparison of results from these two satellites are crucial to better understanding the biases between ascending
passes and descending passes seen in both missions, the cause of which may be geophysical in nature. Scientists representing both the Aquarius and
SMOS Missions have concluded that providing observational-based measurements that are harmonized between Aquarius, SMOS, and in situ instruments
will be the most help to the scientific community.
|
Although everyone knows that seawater is salty, few know that even small variations in ocean surface salinity (i.e., concentration of dissolved
salts) can reveal important information about changes in Earth's water cycle, ocean circulation and climate. Throughout Earth's history, the
weathering of rocks has delivered minerals, including salt, into the ocean. Over decades to centuries, the amount of salt in ocean basins has
remained relatively constant. On the other hand, processes that move water into, out of, and around the ocean are in constant motion. As a
result, monitoring salinity allows scientists to better understand these processes and how they are changing. The impact of such changes
could include altering ocean circulation patterns which move heat around the globe, drive Earth's climate, and affect our daily lives.
The Water Cycle
Some water cycle processes, including evaporation of ocean water and formation of sea ice, increase the ocean's salinity. These salinity-raising
factors, however, are offset by processes that decrease salinity: input of fresh water from rivers, precipitation of rain and snow, and melting
of ice. On land, water cycle processes are tied to vegetation patterns: deserts occur in regions where evaporation is high and rain forests
occur in areas of high precipitation. Similarly, over the ocean, the regional differences between evaporation and precipitation are correlated
with patterns of sea surface salinity. This can be seen by comparing historical maps of ocean surface salinity with data showing the imbalance
between evaporation and precipitation. In general, ocean regions dominated by evaporation have higher salinities and areas with high
precipitation have lower salinities.
Several recent studies have suggested that seawater is becoming fresher in high latitudes and tropical areas dominated by rain, while in
sub-tropical high evaporation regions, waters are getting saltier. Every seven days, Aquarius provided a new global map of salinity, delivering
steady and reliable information about the vast ocean where about 86% of global evaporation and 78% of global precipitation occur.
Aquarius's continuous coverage has allowed scientists to monitor variations in the water cycle and determine if it is indeed accelerating in
response to climate change.
Density-Driven Circulation

Surface winds drive currents in the upper ocean. Deep below the surface, however, ocean circulation is primarily driven by changes in
seawater density, which is determined by salinity and temperature. In some regions — such as the North Atlantic near Greenland — cooled
high-salinity surface waters can become dense enough to sink to great depths. Perturbations to this process, for example from melting of
polar ice and associated decrease in seawater salinity, could have significant impacts on Earth's climate. This is because the ocean holds
and transports a tremendous amount of thermal energy: the heat stored in the top 3 meters (10 feet) of the ocean is equivalent to the
amount held by the entire atmosphere, with an average thickness of about 100 kilometers (62 miles).
Climate Change Implications

The weekly global coverage of Aquarius is crucial because the geographic coverage from in-water observing systems (e.g., ships, buoys) is
not extensive enough to fully understand how changes in global salinity affect climate, and vice versa. Excess heat associated with the
increase in global temperature during the last century is being absorbed and moved by the ocean. Surface ocean and atmospheric temperature
changes may cause evaporation to intensify and, as a result, significantly alter sea surface salinity and ocean circulation patterns. Ocean
change may seem like a "faraway" problem but, as the major driver of our planet's climate, it has the potential to impact humans everywhere.
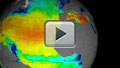
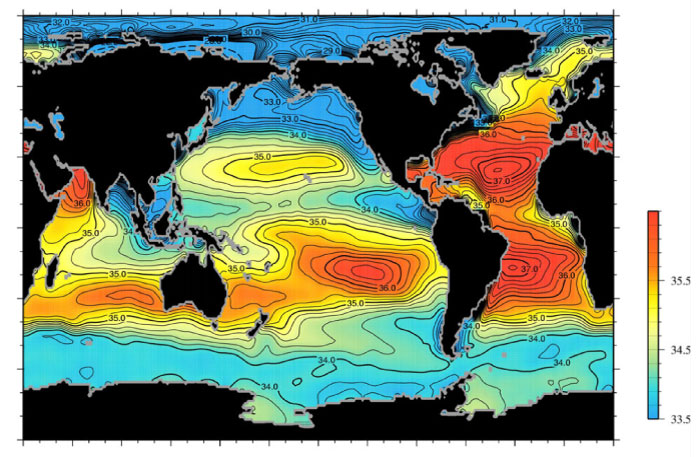
Based on historical observations from in-water instruments collected before the launch of Aquarius,
this global map of ocean surface salinity shows areas of high salinity in red (equivalent to 36 parts per thousand or higher)
and areas of low salinity in blue (equivalent to 34 parts per thousand or lower). Source: World Ocean Atlas, 2009