Education: Analyzing Monthly Environmental Data
Analyzing monthly environmental data from the North Atlantic Ocean will help you to learn more about how the water cycle
affects sea surface salinity. Your challenge is to find the data set that most closely corresponds to sea surface salinity
patterns. A Data Analysis Sheet will help you keep track of your findings and
respond to the Key Question for each data set.
Other Data Sets
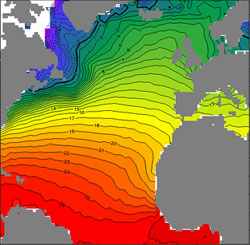
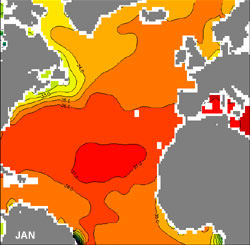
Activity: Air Temperature vs. Sea Surface Salinity
Click the green button for monthly images!
Monthly images in PDF format: Air Temperature (2.2 MB) | Salinity (1.4 MB)
Other Data Sets
- Sea Surface Temperature (ST)
- Evaporation (EV)
- Precipitation (PT)
- Evaporation minus Precipitation (EP)
Activity: Air Temperature vs. Sea Surface Salinity
Click the green button for monthly images!
Monthly images in PDF format: Air Temperature (2.2 MB) | Salinity (1.4 MB)


Questions or comments? Contact Annette deCharon, Senior
Science Educator and Aquarius EPO Manager.