Education: Water Cycle Exploration
Every day water moves around the planet - falling as rain, running through rivers, evaporating from the ocean, melting from ice.
While we can see some of these processes in our everyday lives, NASA satellites provide an opportunity to see them happen
across the globe.
This interactive allows you to explore and compare data from three NASA satellite missions: Aquarius (which measured ocean salinity), GRACE (using gravity to understand water storage), and TRMM (measuring precipitation).
While it's not possible to "see" every part of the water cycle, satellite data can help us to observe how water flows through the atmosphere, the oceans, and on land.
By considering questions and observing data side-by-side, you can learn how NASA data sets, when used together, can provide a more complete understanding of water in our Earth system.
 |
 |
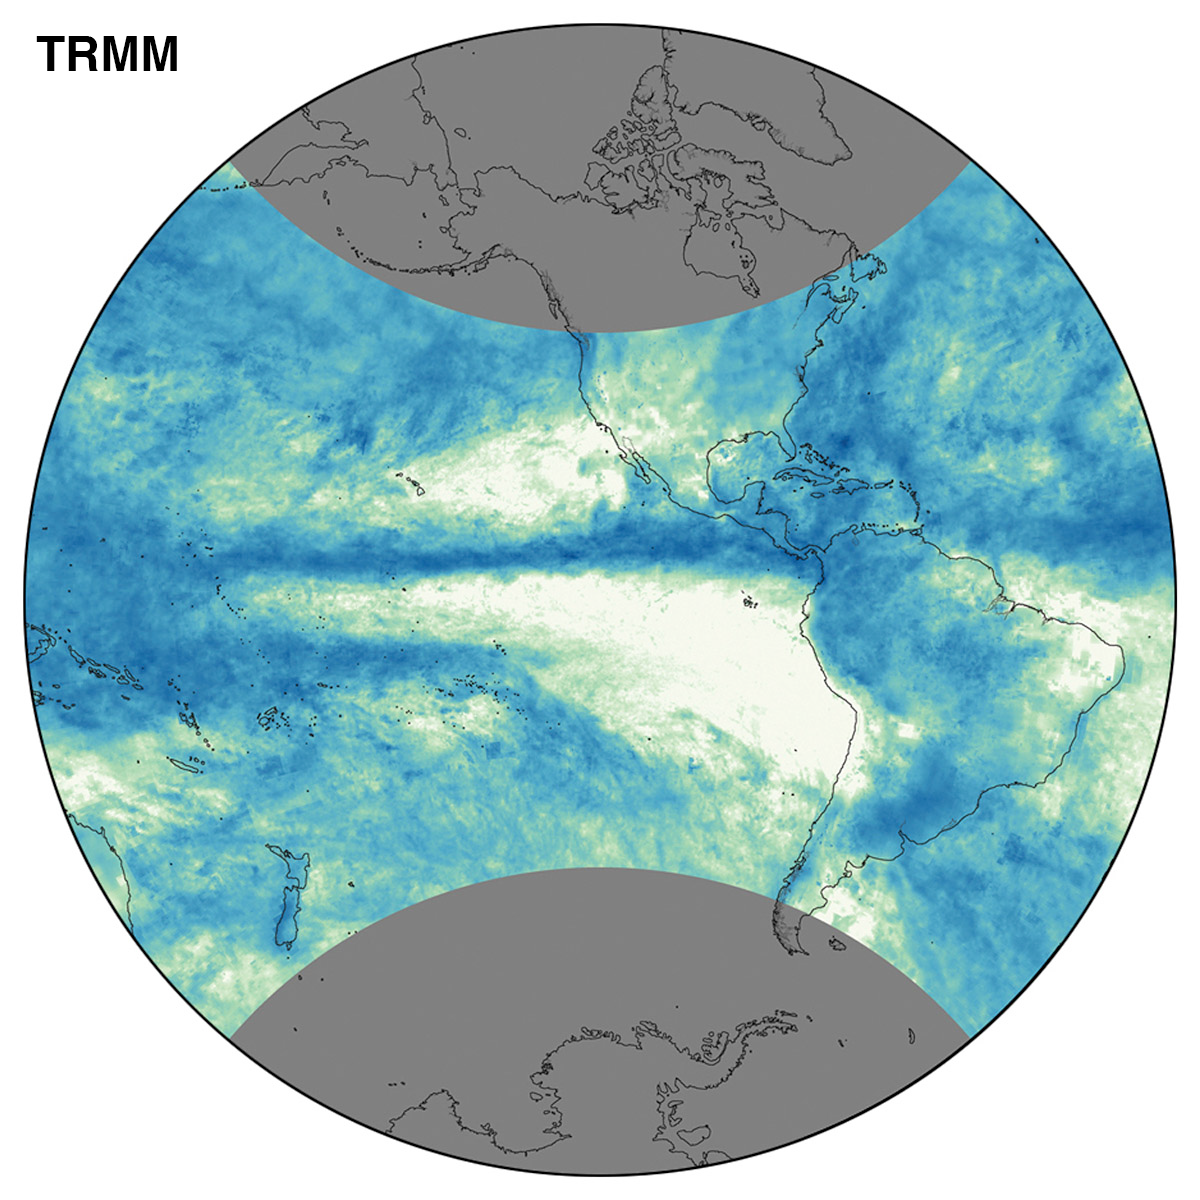 |
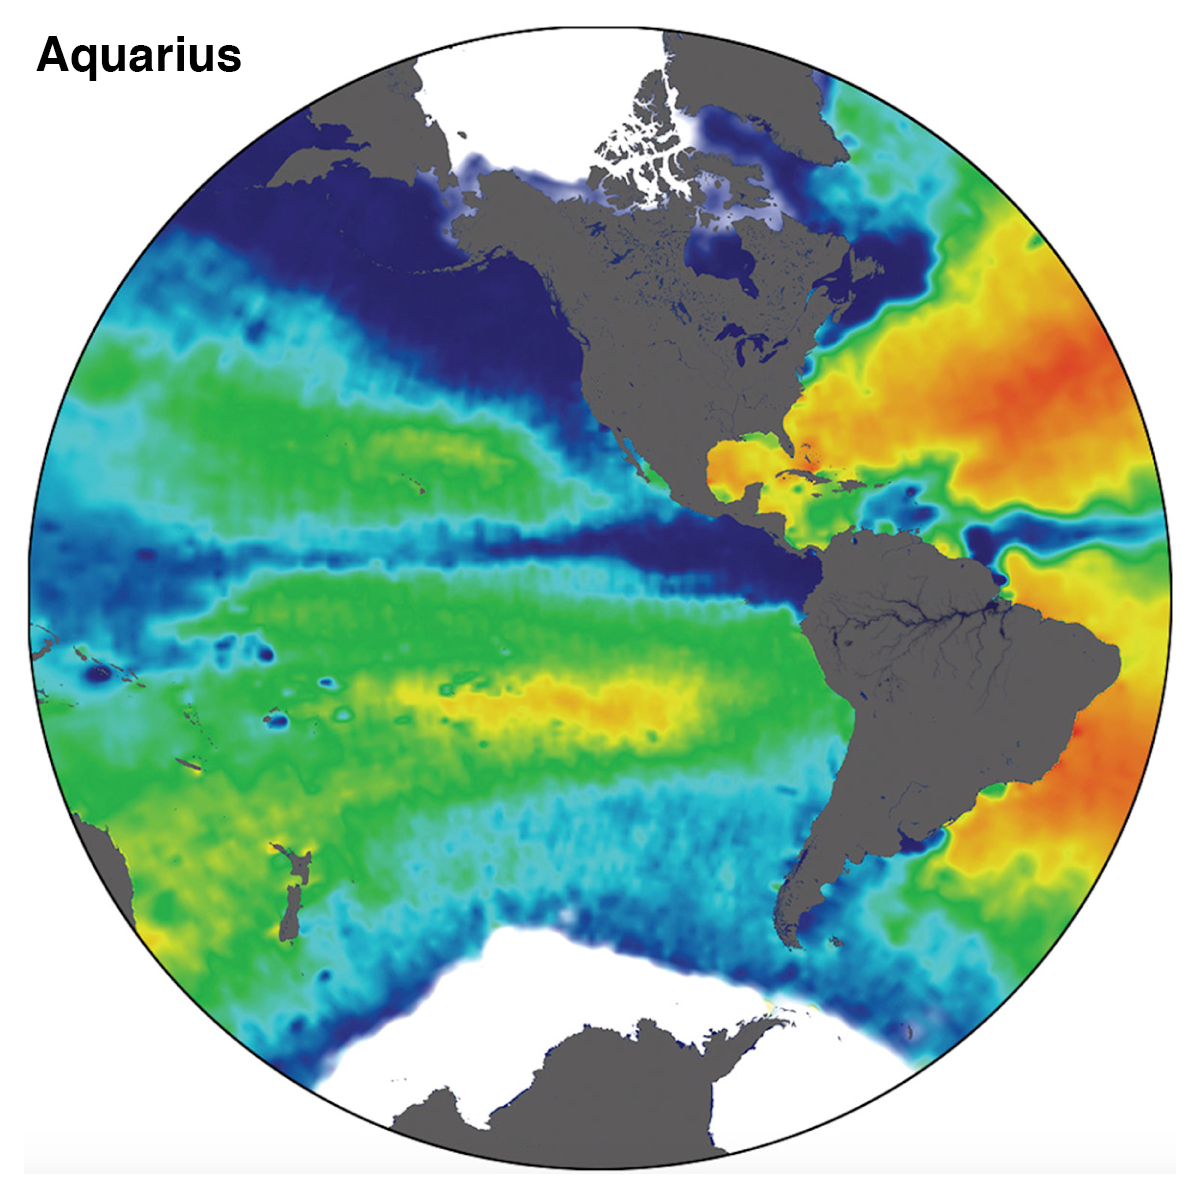
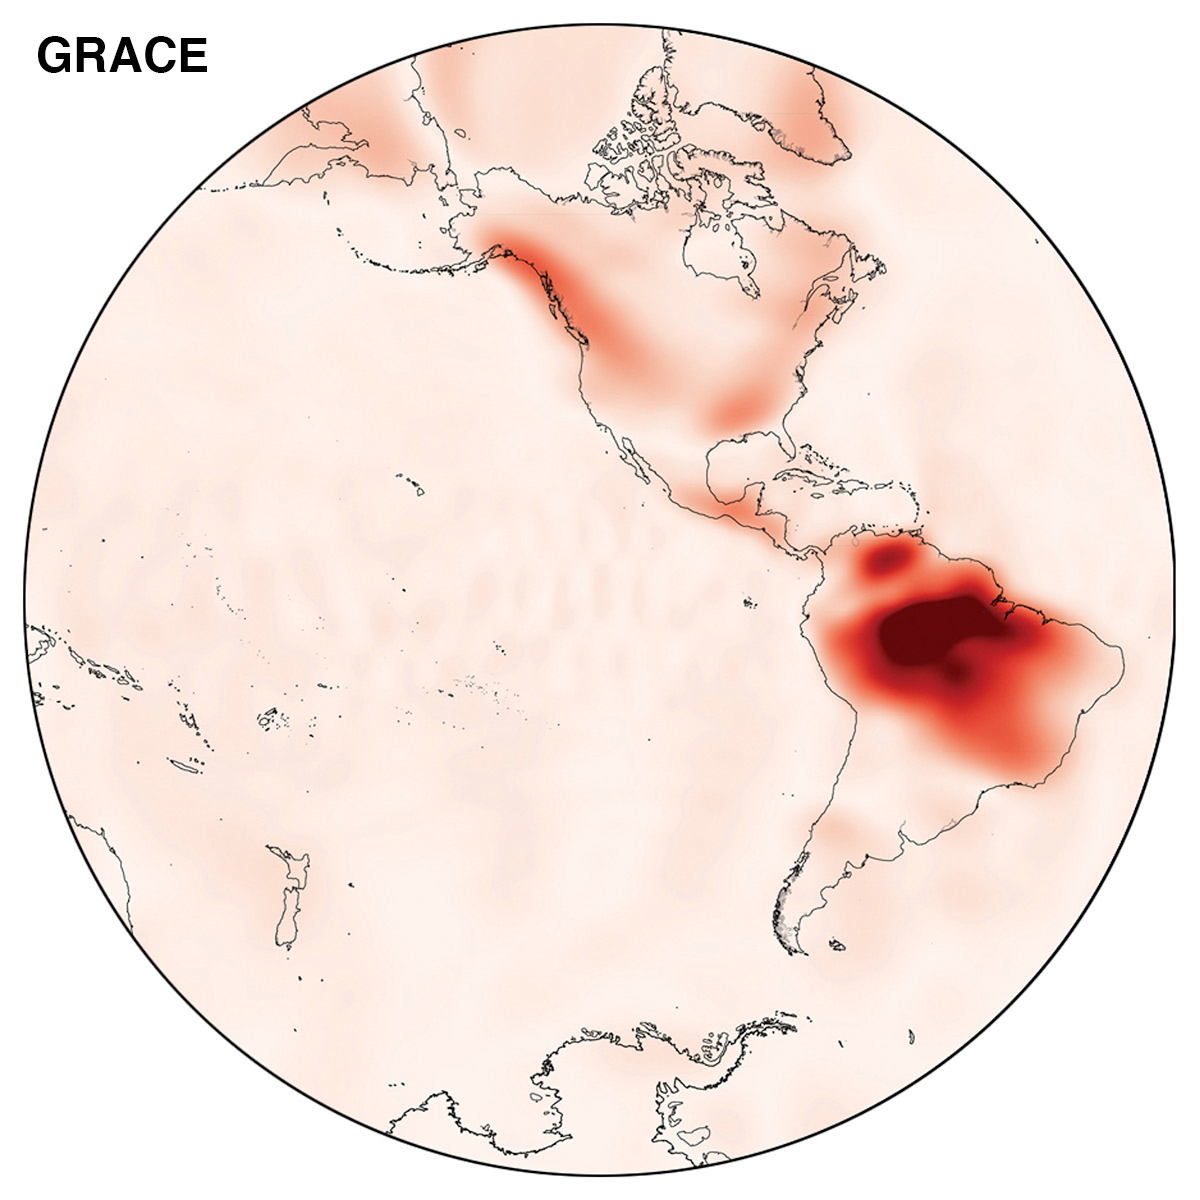
| Aquarius – Sea Surface Salinity. Salinity is the measure of dissolved salt in the ocean. Areas in blue represent low salinity at the surface, and areas in dark orange represent high salinity at the surface. | GRACE – Seasonal Changes in Land Water Storage. GRACE measures Earth’s gravity precisely enough to map the movement of water stored below and on the Earth’s surface. Over the course of a year, seasonal gravity changes reflect the large amount of water cycled through the Amazon River Basin, as shown in dark red. | TRMM – Total Rainfall. This image was created using data from the Tropical Rainfall Measuring Mission (TRMM). Dark blue areas had the most rainfall; pale green areas had the least. TRMM orbits near Earth's equator with a sampling footprint between 35°N and 35°S, measuring tropical and sub-tropical rainfall. TRMM doesn't collect data in the higher latitudes, which are shown as gray areas on the map. |
 |
Make Your Own Water Cycle Exploration Wheel
If you'd like to assemble your own Earth Wheel this PDF contains a
list of necessary equipment (scissors, eyelets, etc.) and instructions. For more information about the Earth Wheel and how satellite
missions can work together to evaluate large-scale Earth processes, check out this
webinar from Earth Science Week in 2014.