Disclaimer: This material is being kept online for historical purposes. Though accurate at the time of publication, it is no longer being updated. The page may contain broken links or outdated information, and parts may not function in current web browsers. Visit the NASA Salinity website for more information.

Education: Water Cycle Exploration

Part 1: TRMM and Aquarius
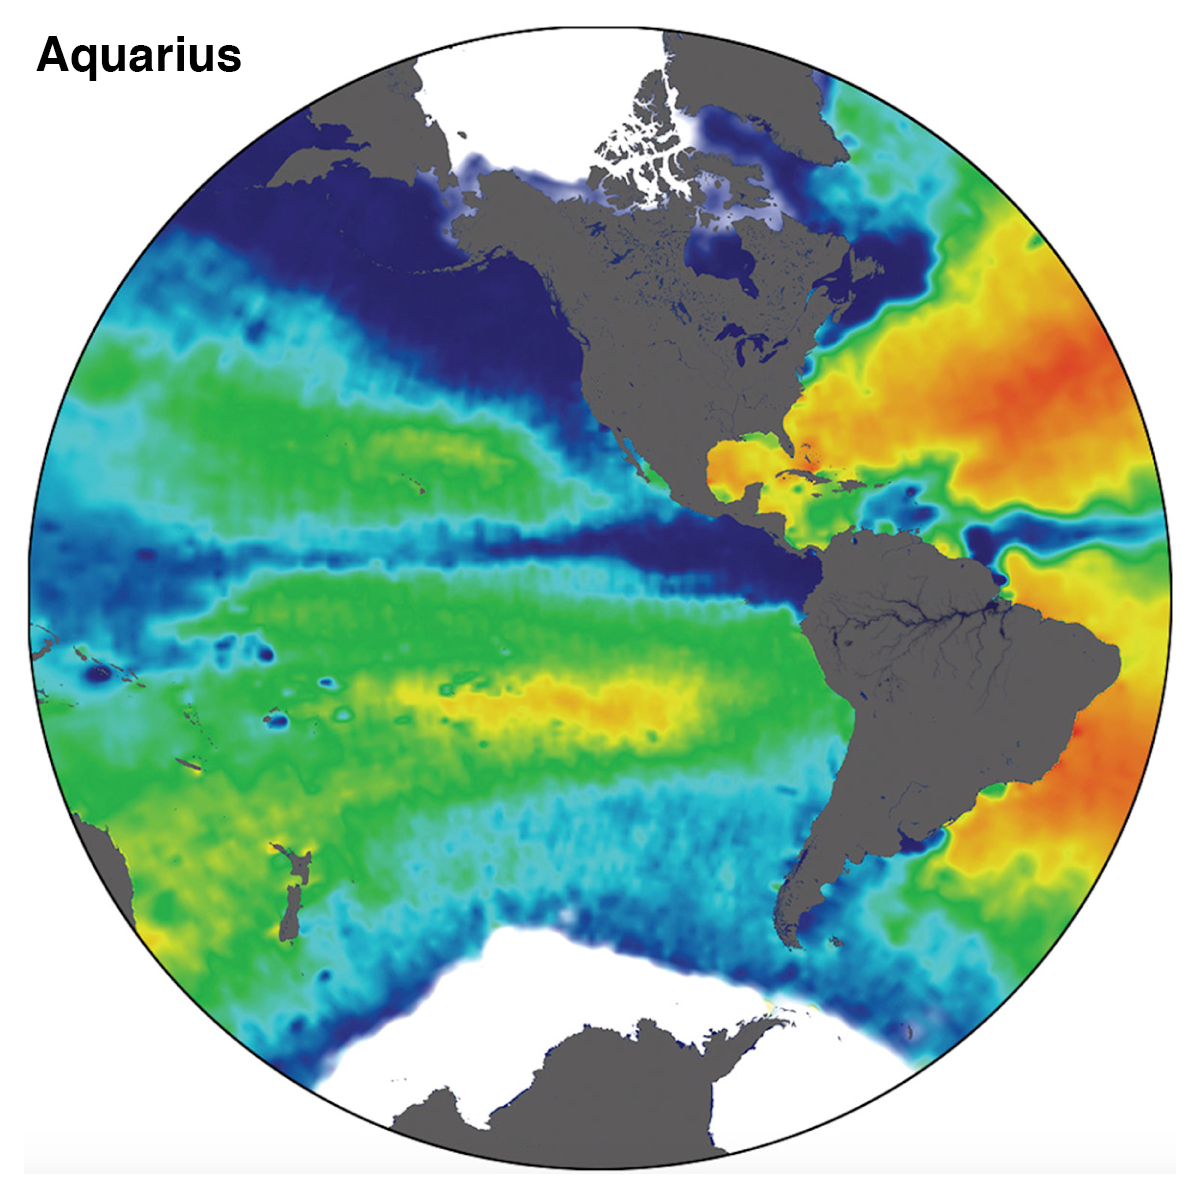
Aquarius measured the salinity of the ocean at the surface. Orange to red areas show the highest salinities, and green to blue areas show lower salinities (see image below). The second dataset was collected by 
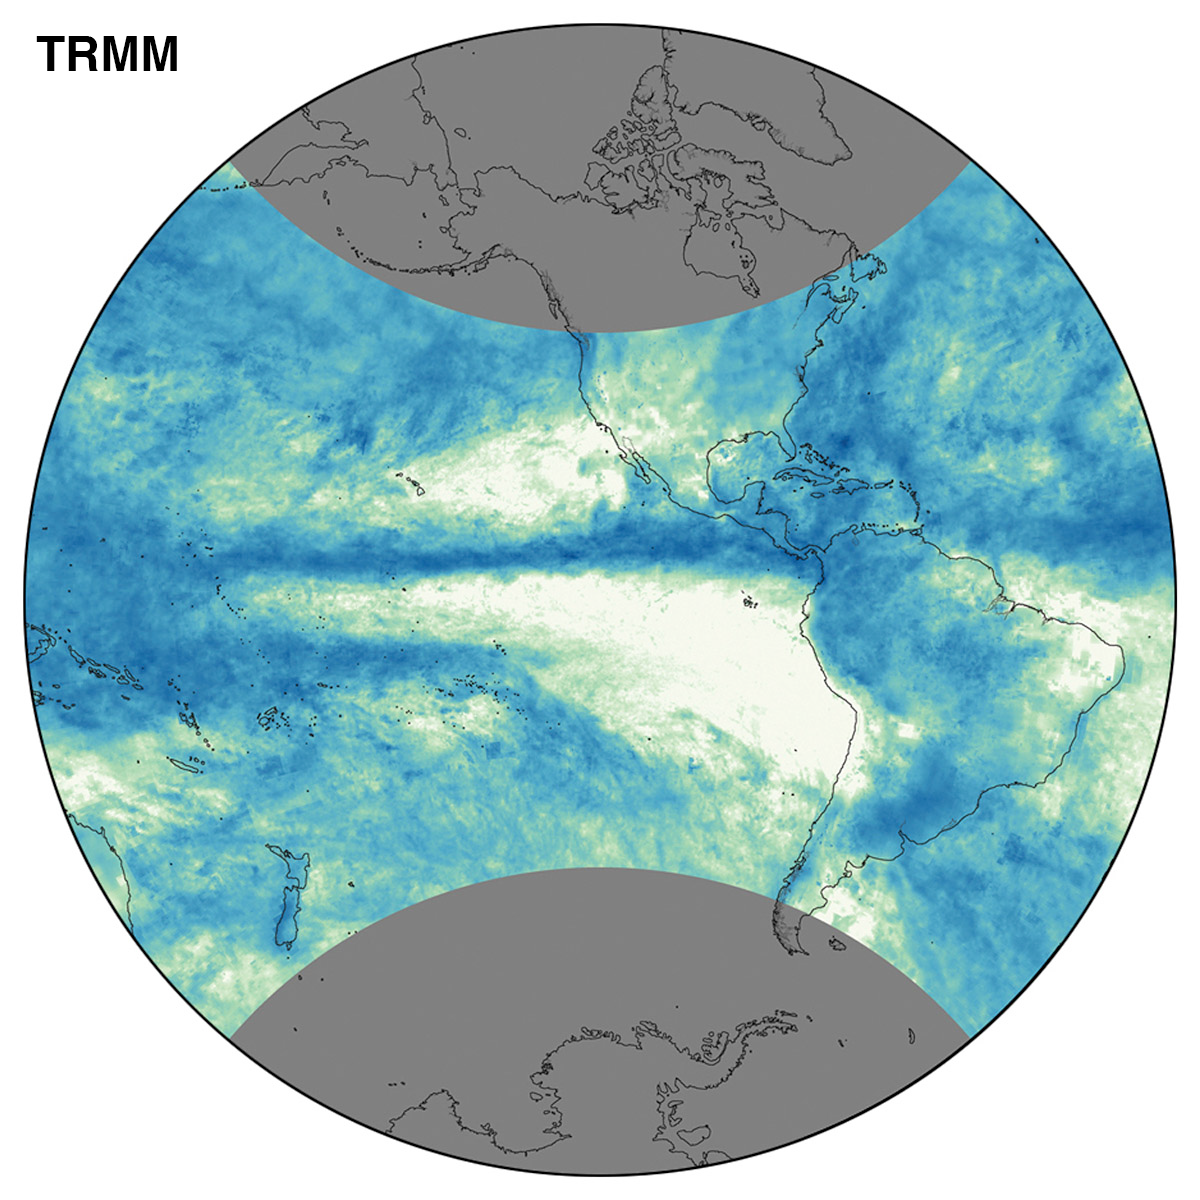
TRMM, and measures the amount of precipitation over an area, with the darkest blue color indicating the most precipitation (click on the image to view precipitation).

There is an interesting area in the Pacific, where values of low salinity appear north of the equator, dividing the North and the South Pacific.

To determine what may be causing this area of low salinity, click on the image to compare data from Aquarius (salinity) and TRMM (precipitation).

Questions
  1. Both of these datasets were taken in the same month (October 2012). Which areas of this map were receiving the most rainfall at this time?
  2. What correlations can you observe between the two types of data? What are the areas of differences?
  3. Using these data, can you explain the reason why there is a low salinity area around the equator in the Pacific Ocean?
Explore Further
  • View more Aquarius data (including weekly, monthly and yearly data) in the data gallery.
  • Watch a video on precipitation and condensation and their effect on the ocean.


Part 2: TRMM and GRACE
The TRMM precipitation measurements can tell a part of the story of the water cycle - where precipitation is occurring (see image below) - but other measurements help to understand the bigger picture. GRACE precisely measures the Earth's gravity to reveal places where there is a large amount of change in the amount of water present during the year (click on the image to view change in water storage). The areas of darkest red have the most change over time.

To look at the effect of precipitation on land, click on the image to compare data from GRACE (change in water storage) with TRMM (precipitation).

Questions
  1. GRACE measures the change in the amount of water stored using measurements of gravity. Where on the map is the most change occurring?
  2. Why might some land areas have dramatic changes in seasonal water storage?
  3. Water enters this part of South America in abundance via rainfall. What are some of the things that can happen to the water once it falls?
Explore Further
  • Learn how GRACE makes measurements using gravity.
  • Watch a video on what happens to a molecule of water once it leaves the ocean.


Part 3: GRACE and Aquarius
Precipitation isn't the only part of the water cycle that can be observed through salinity measurements captured by Aquarius. By focusing on both land and the ocean (for example with GRACE and Aquarius), more features are revealed. Click on the image below to view 1) GRACE (change in water storage) and 2) Aquarius sea surface salinity.
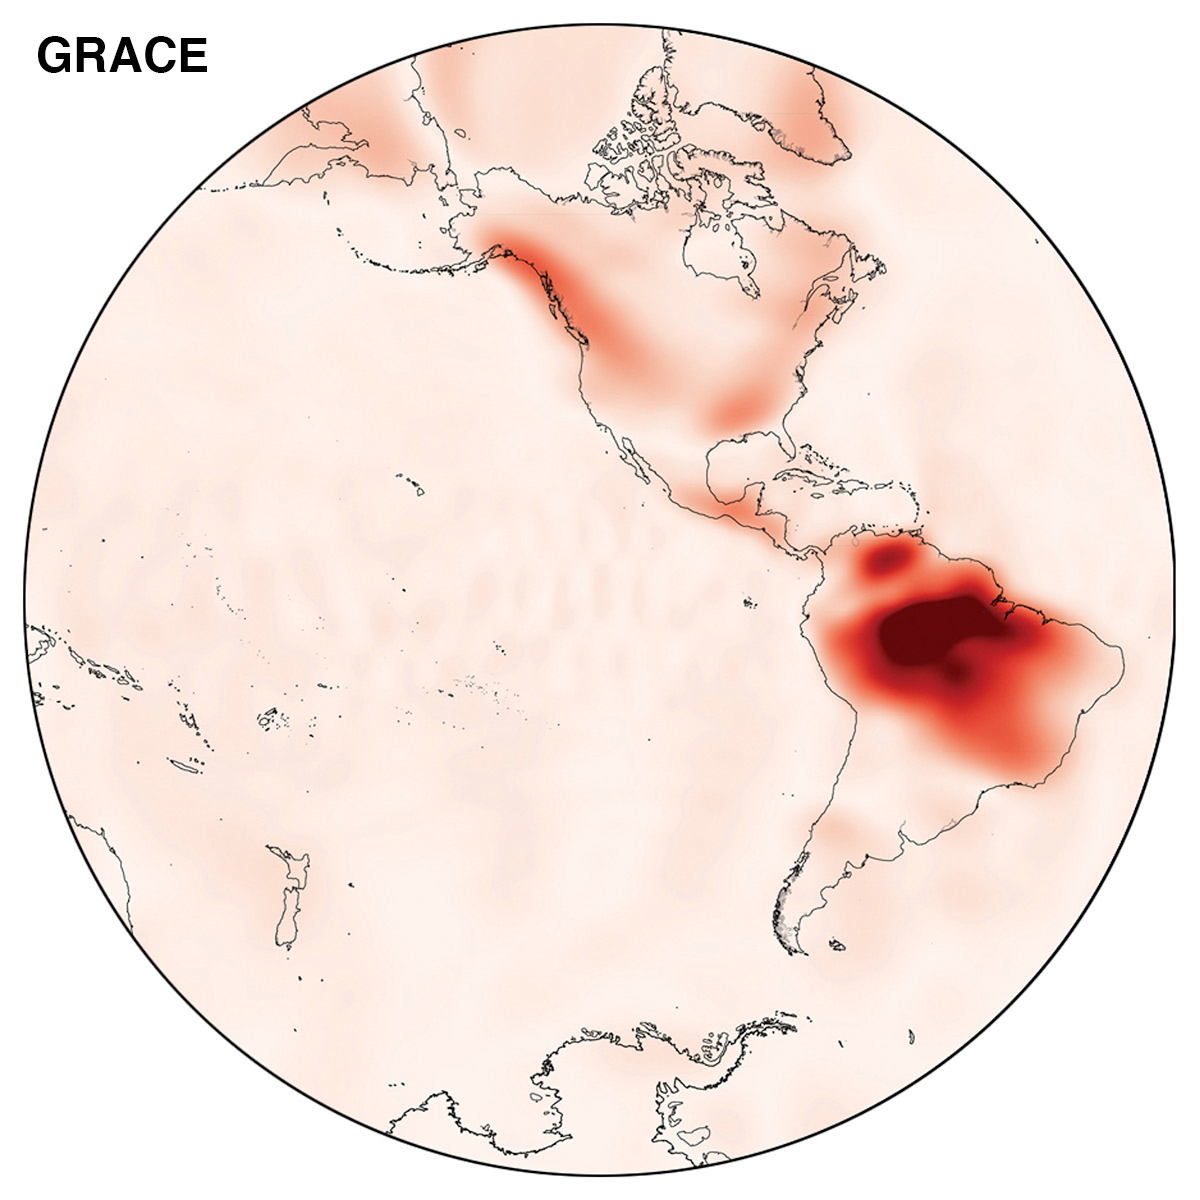
Questions
  1. What effects of water cycle patterns on land can be seen in ocean salinity?
  2. Notice the blue (low salinity) area to the north and east of South America. What could be contributing to this area of low salinity?
  3. The area of red in the GRACE data is referred to as the "tropical rainforest". What evidence do you have that supports this nickname?
Explore Further
  • Learn how GRACE makes measurements using gravity.
  • Watch this low salinity "plume" develop over a year of Aquarius data.