Education: The Who, What, Where, When, and Why of Data!
For many scientific research projects, collecting accurate data is the main driver. Conclusions cannot be made without data and hypotheses cannot be proved or disproved without it. Data can come in many forms and can be used to answer a whole host of questions about how ocean processes work, how the ocean is changing, and what these changes mean for the future of oceanographic exploration.
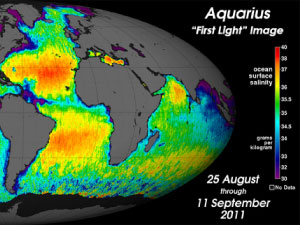
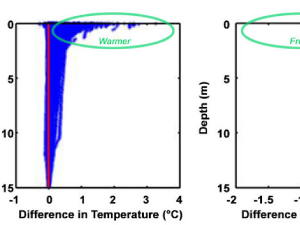
In this clip, Dr. Gary Lagerloef discusses how scientists were able to use Aquarius data to observe major freshwater events in the Amazon River outflow and the Bay of Bengal.
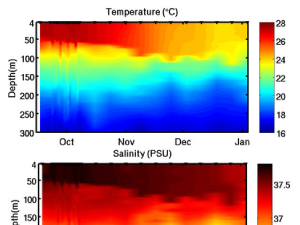
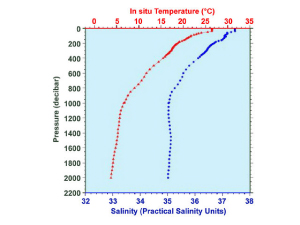
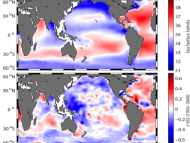
Argo floats measure salinity at pre-programmed depths on a regular schedule, sending data back to oceanographers to view. Dr. Fred Bingham walks us through what that data might look like when visualized from month to month and this gives us an idea of how salinity varies throughout the year.
Dr. Yi Chao explains how satellite technology has evolved throughout the years to deal with the challenge of measuring ocean salinity from space.
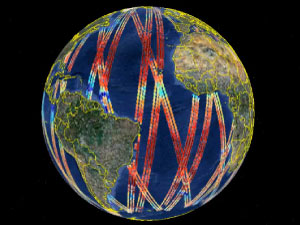
In this clip, Dr. Gary Lagerloef discusses how scientists were able to increase the accuracy of the Aquarius satellite through adequate sampling and broader spatial coverage.
Simply gathering oceanographic data is not enough: scientists must then translate that data into something they can see and interpret. Learn how by watching this video!
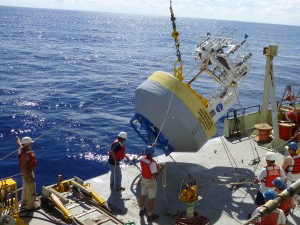
Dr. Fred Bingham introduces a specific type of instrument that "crawls" up and down a mooring line. The importance of this new technology, as well as what can happen if things go wrong, are discussed in this clip.
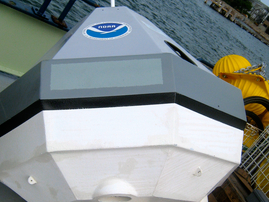
During SPURS, three research moorings were deployed. In combination, these three stationary platforms collected data in the SPURS region, an area in the northern mid-Atlantic, playing a key role in understanding the high salinity area.
Learn how (and why) sea surface temperature and salinity might be varying at the SPURS site in the Atlantic Ocean.
Observing changes in global ocean salinity and identifying trends involves the work of many scientists to process multiple types of data.