Education: Mapping in Four Dimensions
As technology has advanced, scientists have been able to add many layers to their data-collection methods. Oceanographic research has evolved from single-point measurements taken from the side of a ship, to autonomous gliders that collect data throughout the ocean over many years, and there are now satellite missions making observations of Earth from outerspace. Using all of these dimensions has allowed for more large-scale observations of oceanic and atmospheric processes.
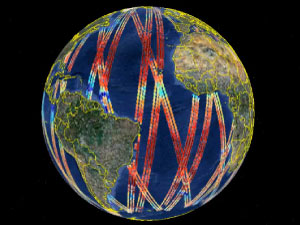
Dr. Gary Lagerloef uses data collected from NASA's Aquarius satellite to show ocean processes taking place in the Gulf of Mexico (September, 2011).
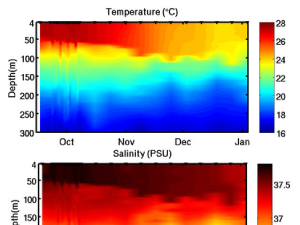
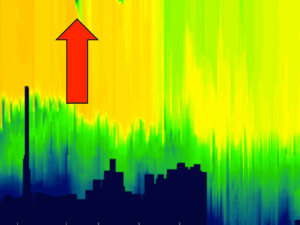
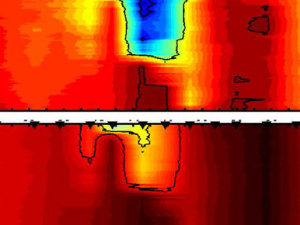
Argo floats measure salinity at pre-programmed depths on a regular schedule, sending data back to oceanographers to view. Dr. Fred Bingham walks us through what that data might look like when visualized from month to month and this gives us an idea of how salinity varies throughout the year.
In this clip, Dr. Gary Lagerloef discusses how scientists were able to increase the accuracy of the Aquarius satellite through adequate sampling and broader spatial coverage.
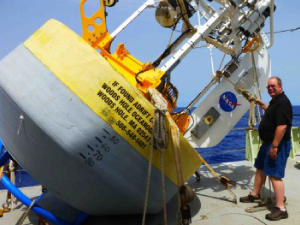
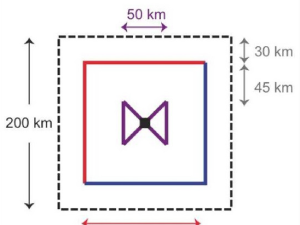
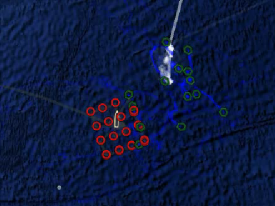
Dr. Eric Lindstrom explains the complex features of the sensor web used during SPURS and their functions within the web. He talks about the technology used in each of them (many use satellite-tracking) and the kinds of data that can be collected from them.
Dr. Fred Bingham introduces viewers to an at-sea glider system, including their importance and function in modern oceanographic research.
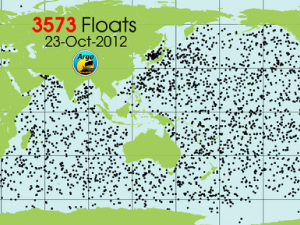
An introduction to the Argo float program, a worldwide network of profiling floats taking measurements in the world's oceans.
An introduction to the types of in-situ instrumentation used during a research cruise to the mid-Atlantic, including surface drifters.
In this clip, data from a Lagrangian Float - as well as its interpretation - are shared.
Dr. Stephen Riser explains the importance of advancing oceanographic research equipment and why a rain event over the ocean can tell us a lot about how the ocean works to move water from place to place.
Drs. David Le Vine and Gary Lagerloef explain how remote sensing has evolved throughout the past few decades, focusing specifically on ocean salinity research in the 2000s.