Gallery
SMAP Sea Surface Salinity - June 12, 2015
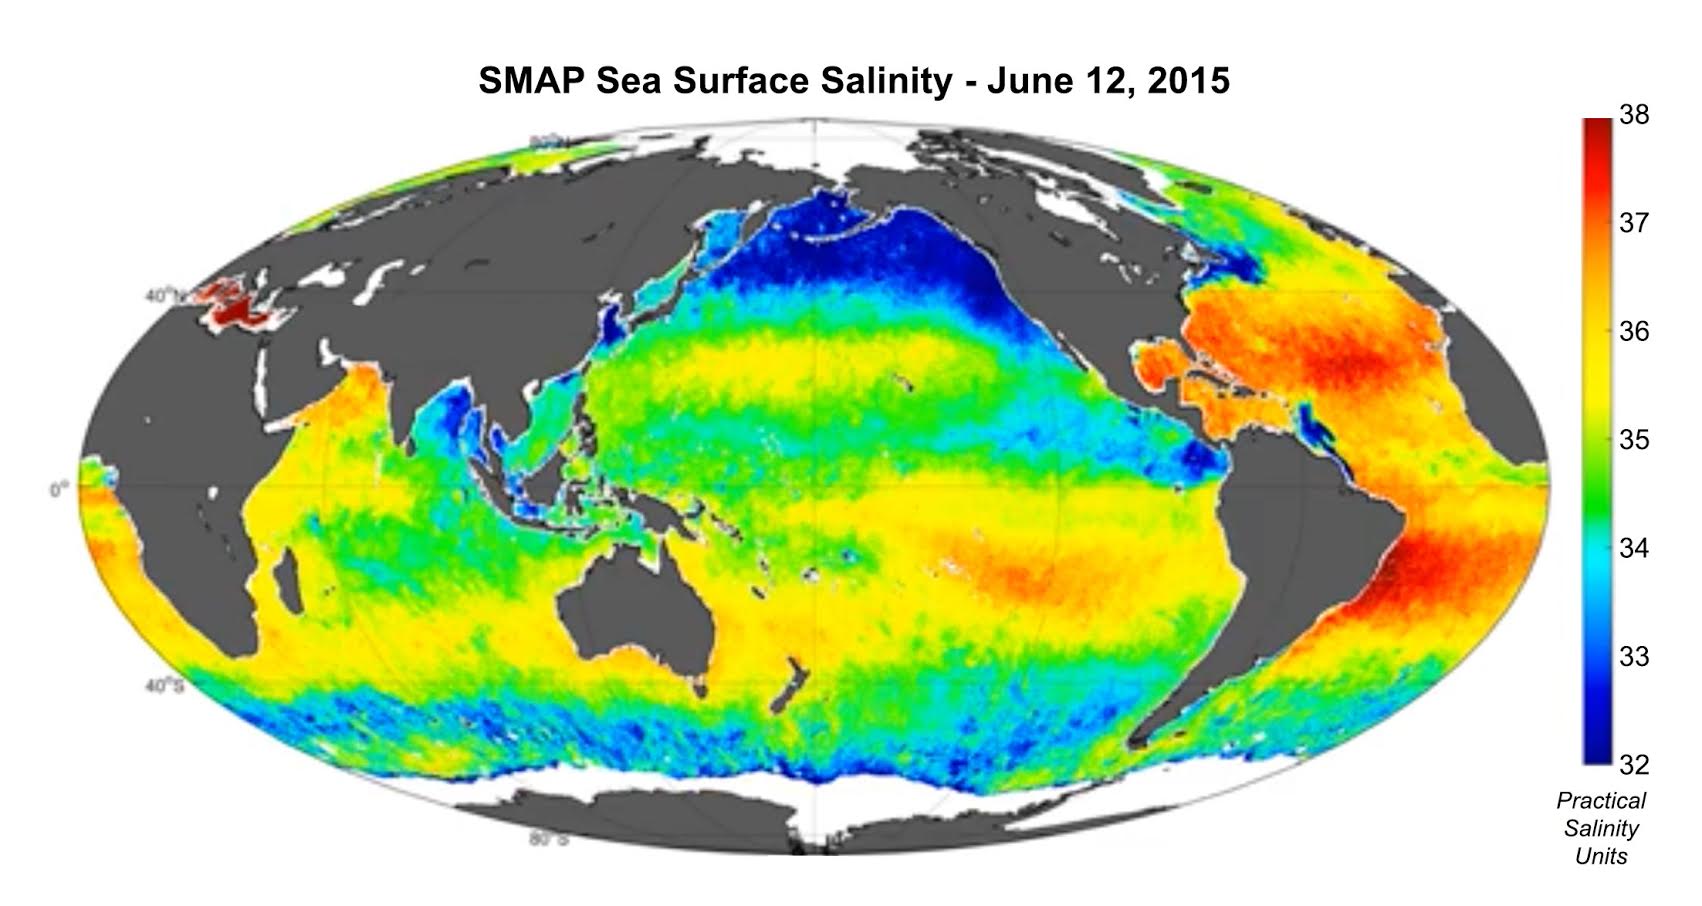
[18-Nov-16] SMAP sea surface salinity data acquired June 12, 2015. Data were processed by Remote Sensing Systems using an 8-day running average and 0.25 degree grid. Credit: Remote Sensing Systems.View: Click on the image to enlarge. Click on the Escape key or anywhere outside the shadowbox to close.
Download: To download a copy, right click on the image and select Save Image As (on a Mac keyboard, click the touchpad while holding down the Control key). To download the highest resolution in our database, first click on the image to enlarge and then save that version.