Gallery
Composite Image: 25-Aug-11 to 05-May-15
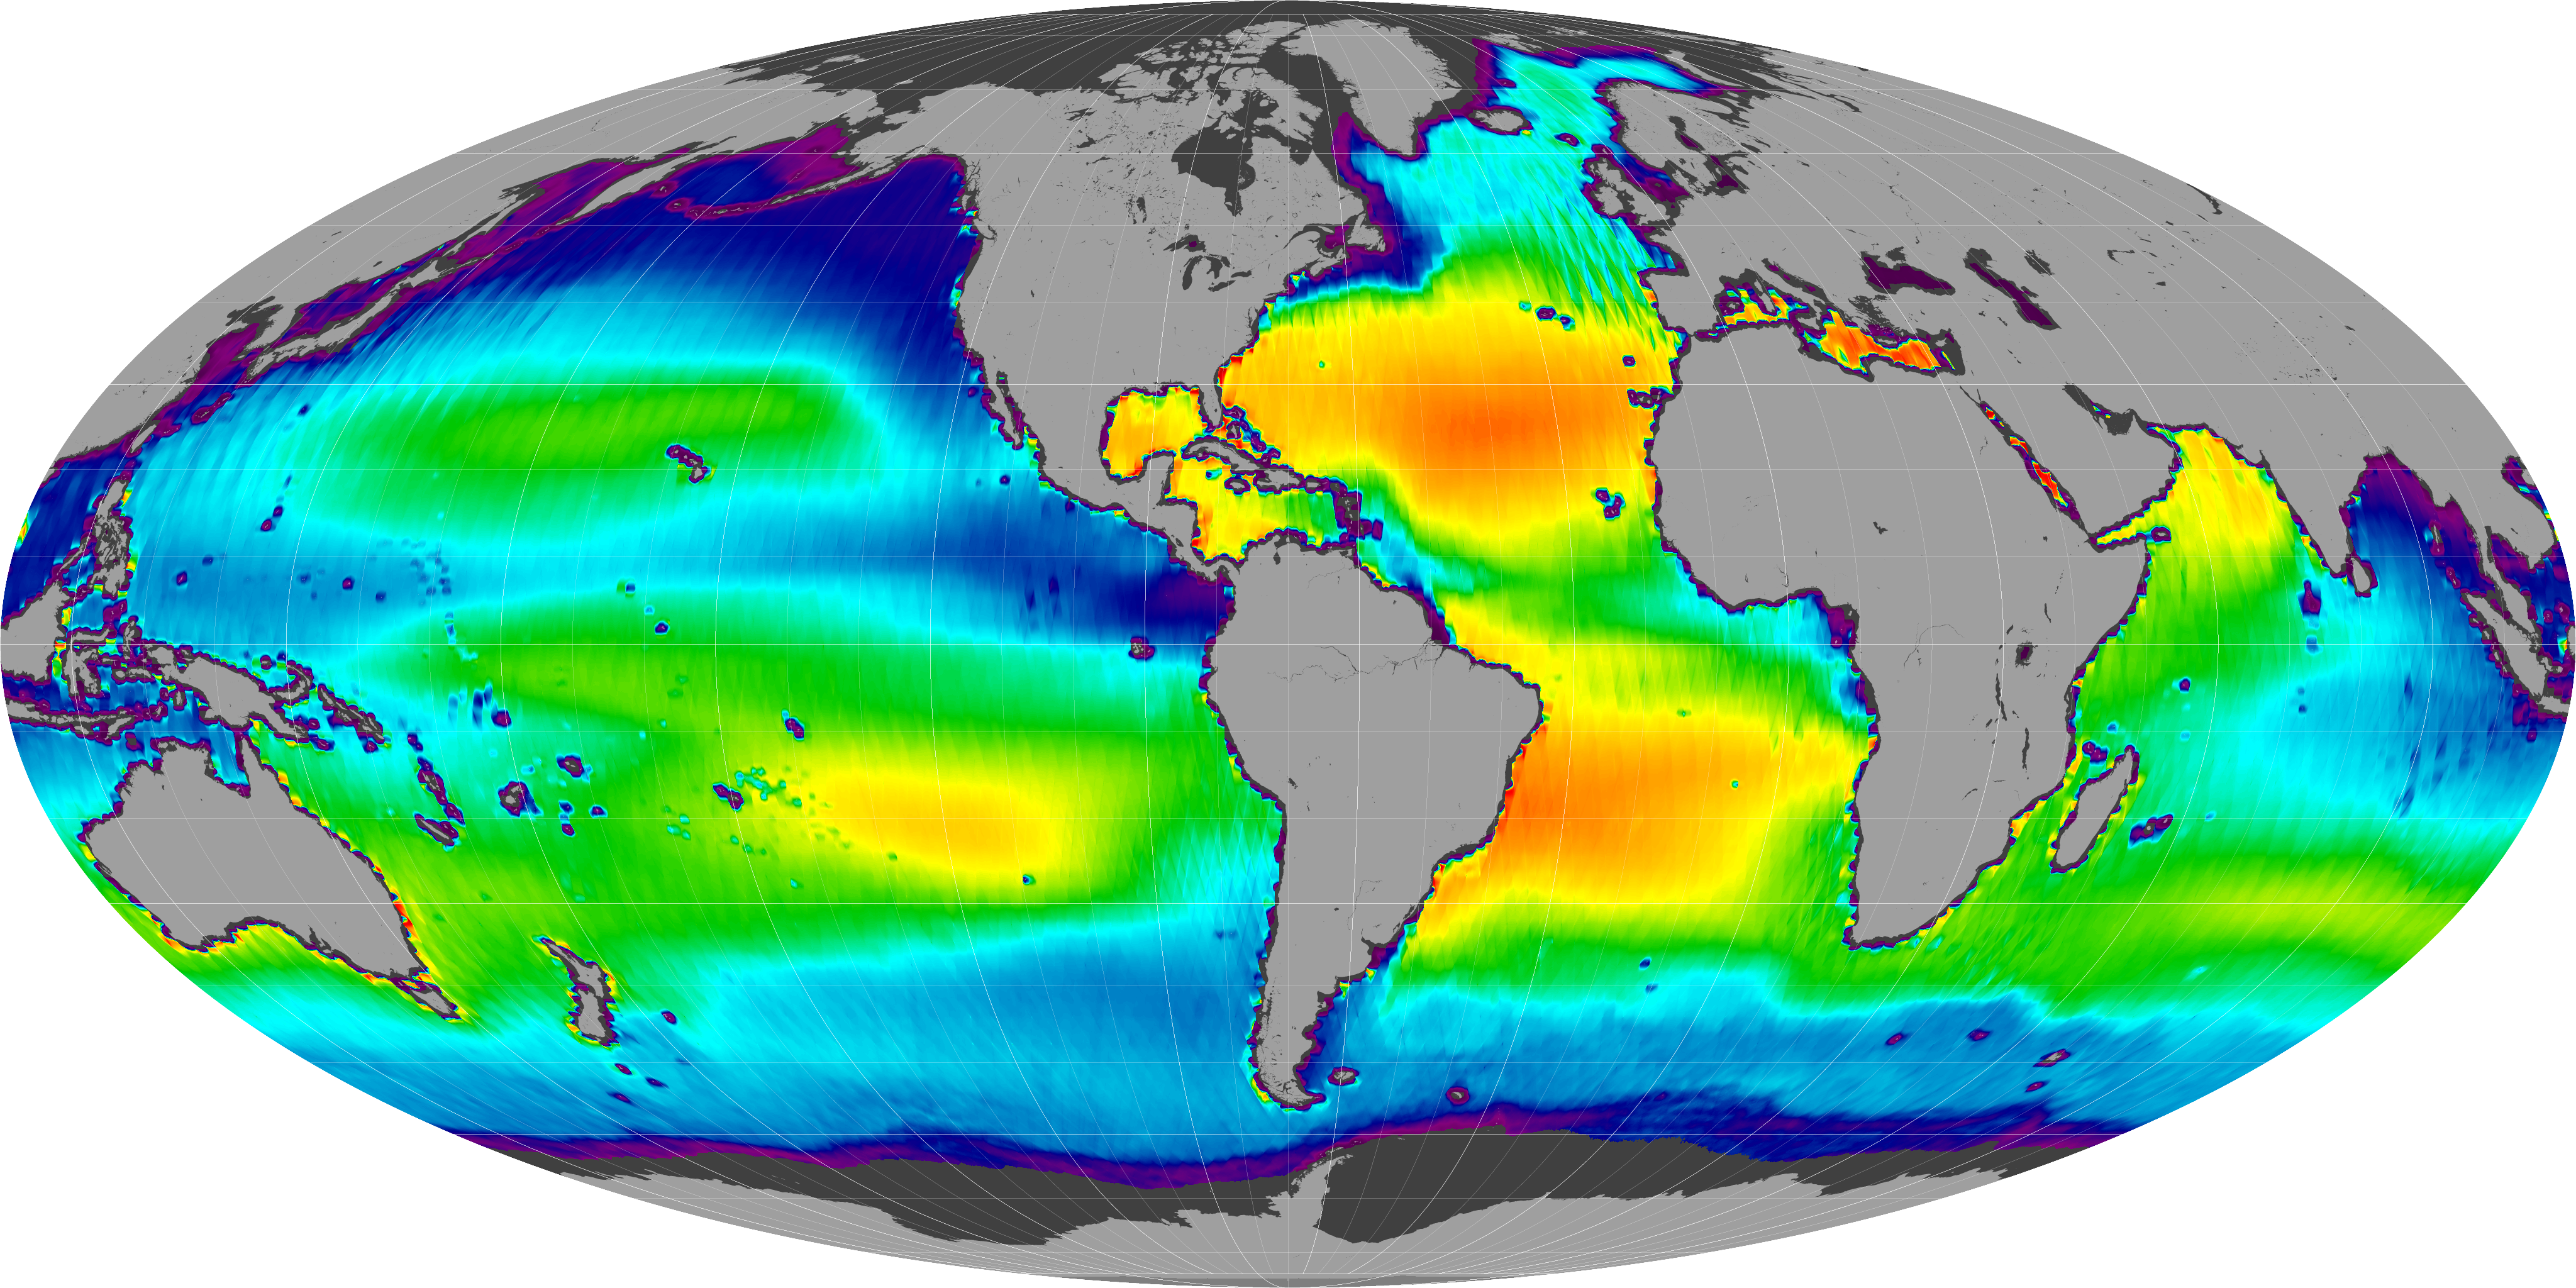
[24-July-18] This map is a composite image of sea surface salinity (SSS) from August 25, 2011 through May 31, 2015 captured by Aquarius. This mission-length composite was created using version 5.0 Aquarius SSS data. Reds show higher salinity (40 grams per kilogram) and purples show relatively low salinity (30 grams per kilogram). Learn more about the Version 5 (V5) data here. Credit: NASA.View: Click on the image to enlarge. Click on the Escape key or anywhere outside the shadowbox to close.
Download: To download a copy, right click on the image and select Save Image As (on a Mac keyboard, click the touchpad while holding down the Control key). To download the highest resolution in our database, first click on the image to enlarge and then save that version.