Gallery
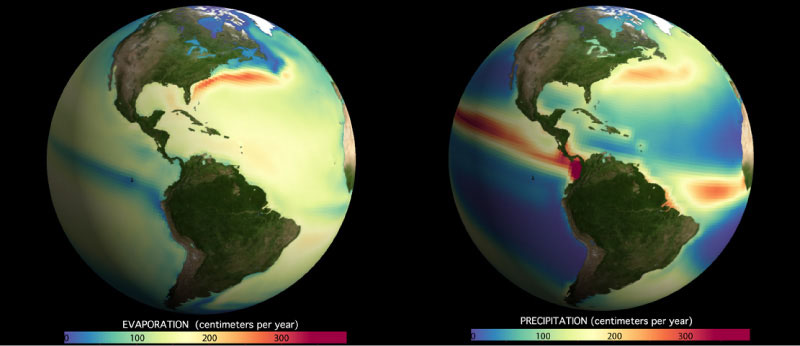
Evaporation and Precipitation in the Western Hemisphere
[27-Apr-11] Evaporation is the process by which water changes from a liquid to a gas or vapor. Evaporation is the primary pathway that water moves from the liquid state back into the water cycle as atmospheric water vapor. Studies have shown that the oceans, seas, lakes, and rivers provide nearly 90 percent of the moisture in the atmosphere via evaporation, with the remaining 10 percent being contributed by plant transpiration. Precipitation is water that falls from clouds to the ground. This can be in the form of rain, snow, sleet, hail, etc.On land, water cycle processes are tied to vegetation patterns: deserts occur in regions where evaporation is high and rain forests occur in areas of high precipitation. Similarly, over the ocean, the regional differences between evaporation and precipitation are correlated with patterns of sea surface salinity. Areas where precipitation is greater than evaporation have a lower sea surface salinity (SSS). Higher SSS generally occurs where evaporation is greater than precipitation. The degree of salinity is a driver of the world's ocean circulation, where density variations due to both salinity and temperature changes at the surface produce changes in buoyancy, which causes the sinking and rising of water masses.
To see the connection between salinity and the water cycle, it is helpful to compare salinity patterns with data showing the imbalance between evaporation and precipitation. This map shows the range in global ocean salinity at the surface based on all historical observations: red areas have high salinity (i.e., 36 PSS or higher) and blue areas have low salinity (i.e., 34 PSS or lower). This map shows average evaporation minus precipitation. Areas that are colored red are dominated by evaporation. The areas that are colored blue are dominated by precipitation. There is a correspondence between the red colors on the evaporation minus precipitation map and the red colors on the average salinity map. This correlation shows the tie between high evaporation in the water cycle and high salinity in the ocean. Likewise, the blue areas on both maps highlight the ties between high precipitation and areas of relatively low sea surface salinity.
View: Click on the image to enlarge. Click on the Escape key or anywhere outside the shadowbox to close.
Download: To download a copy, right click on the image and select Save Image As (on a Mac keyboard, click the touchpad while holding down the Control key). To download the highest resolution in our database, first click on the image to enlarge and then save that version.