Education: Gallery
Salinity Trends over 50 Years
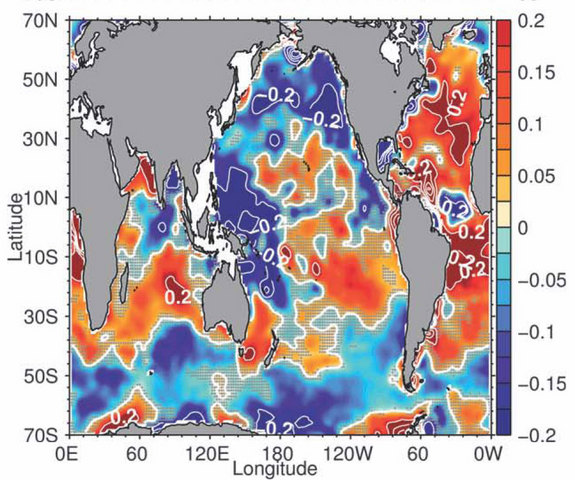
[07-Aug-13] The 50-year linear surface salinity trend in Practical Salinity Units (roughly equivalent to parts per thousand). Red indicates increasing salinity from 1950 to 2000 and blue shows regions where salinity decreased over these 50 years. Contours every 0.2 are plotted in white. Regions where the resolved linear trend is not significant at the 99% confidence level are stippled in gray. Credit: Durack, Paul J., Susan E. Wijffels (2010). Fifty-Year Trends in Global Ocean Salinities and Their Relationship to Broad-Scale Warming. J. Climate, 23, 4342-4362.View: Click on the image to enlarge. Click on the Escape key or anywhere outside the shadowbox to close.
Download: To download a copy, right click on the image and select Save Image As (on a Mac keyboard, click the touchpad while holding down the Control key). To download the highest resolution in our database, first click on the image to enlarge and then save that version.