Gallery
Historical Surface Salinity Measurements
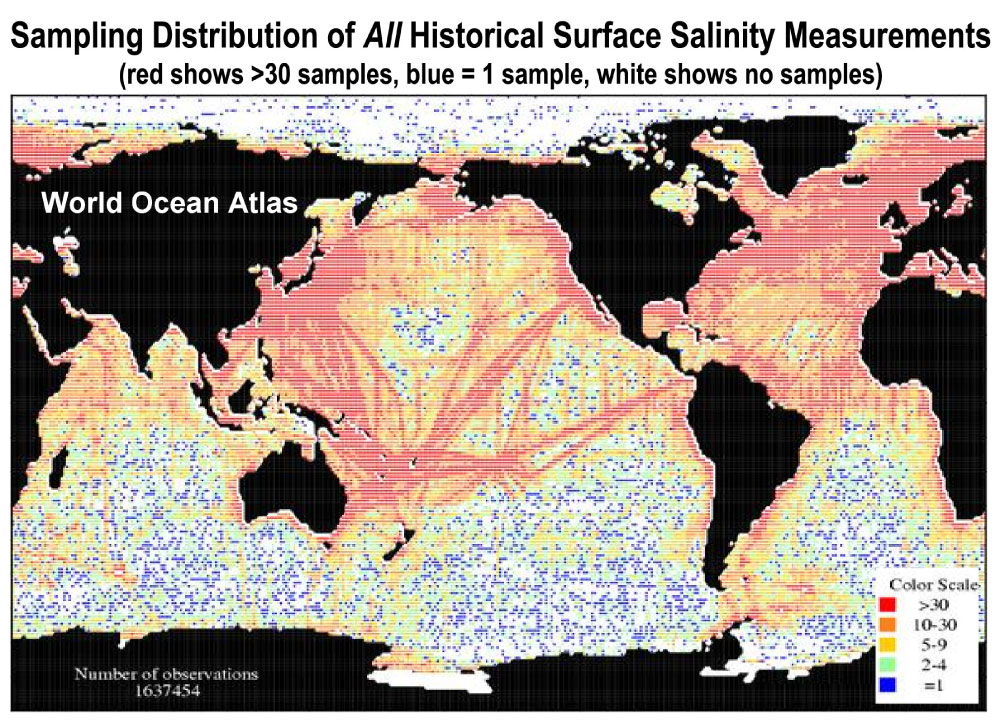
[23-Feb-09] This map shows the sampling distribution of historical surface salinity measurements from ships, buoys, etc. Red dots indicate areas that have over 30 measurements, mostly along shipping lanes. Blue dots shows surface areas where only one surface measurement had been taken and white indicates regions with no historcal surface salinity measurements. Credit: World Ocean Atlas.View: Click on the image to enlarge. Click on the Escape key or anywhere outside the shadowbox to close.
Download: To download a copy, right click on the image and select Save Image As (on a Mac keyboard, click the touchpad while holding down the Control key). To download the highest resolution in our database, first click on the image to enlarge and then save that version.