Gallery
Large Scale Salinity Distribution Features Measured by Aquarius (00:00:20)
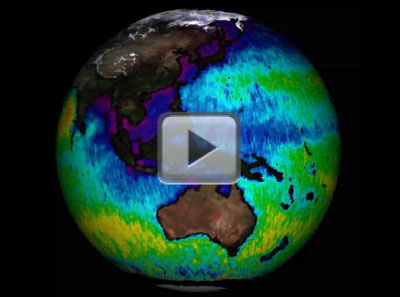
[23-Sep-11] This composite map demonstrates Aquarius' ability to detect large-scale salinity distribution features clearly and with sharp contrast. The map shows several well-known ocean salinity features such as higher salinity (reds and yellows) in the subtropics; higher average salinity in the Atlantic Ocean as compared to the Pacific and Indian Oceans; and lower salinity (blues and purples) in rainy belts near the equator, in the northernmost Pacific Ocean and elsewhere. These features are related to large-scale patterns of rainfall and evaporation over the ocean, river outflow and ocean circulation. Aquarius will monitor how these features change and study their link to climate and weather variations.