Gallery: Radiometer RFI
Radio Frequency Interference (RFI) can cause errors in the salinity estimated by Aquarius by affecting the signal received by the microwave radiometers and the scatterometer.
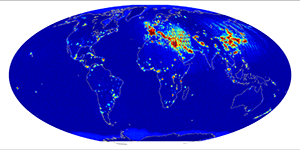
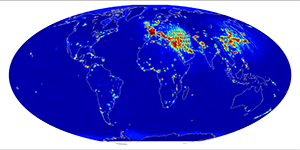
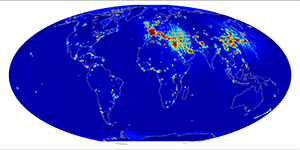
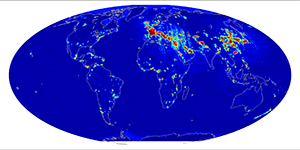
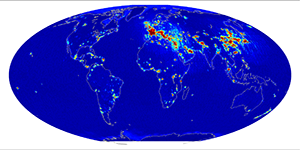
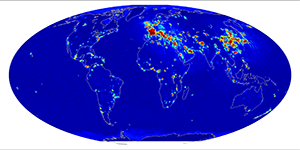
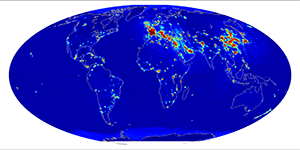
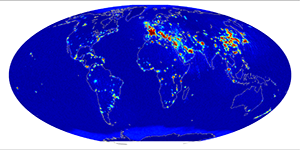
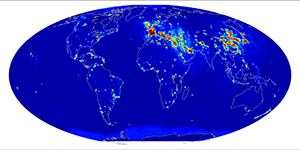
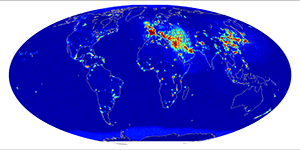
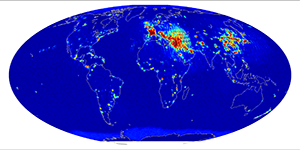
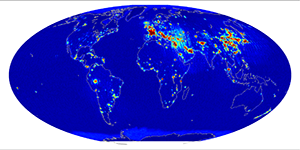
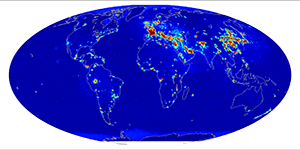
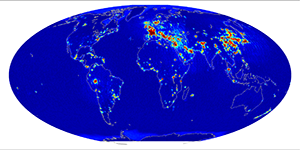
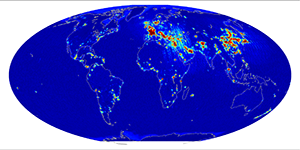
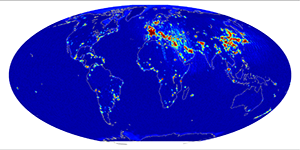
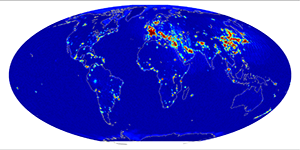
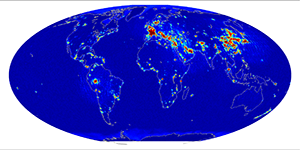
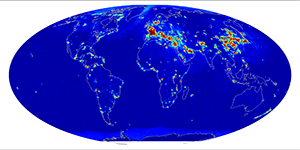
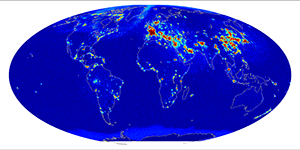
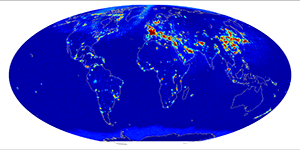
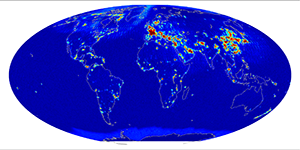
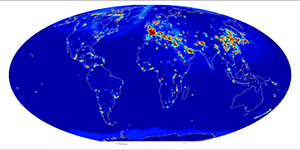
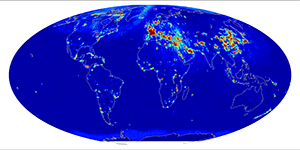
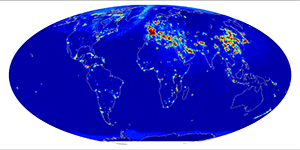
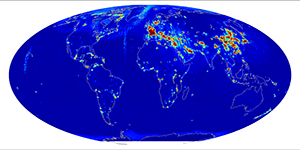
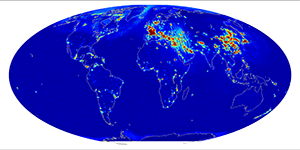
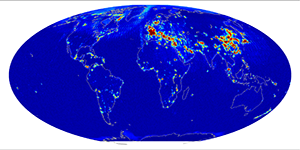
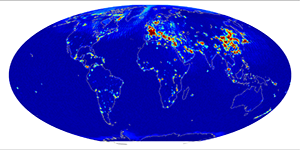
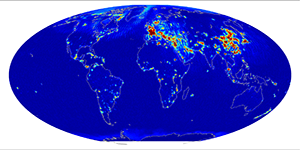
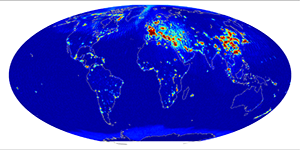
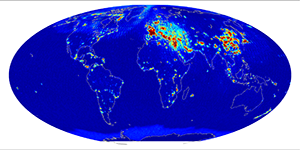
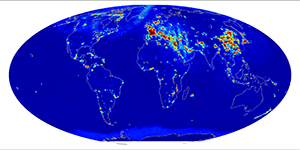
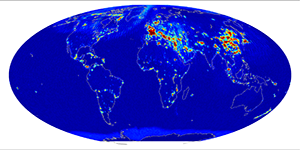
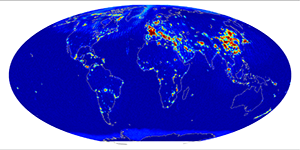
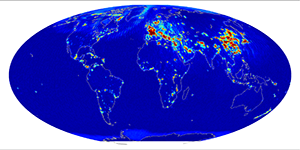
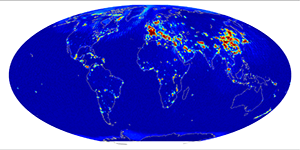
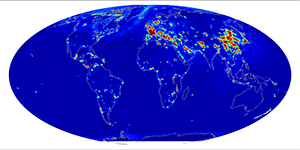
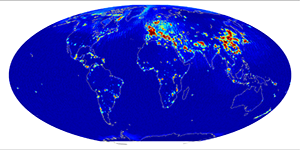
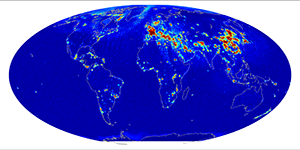
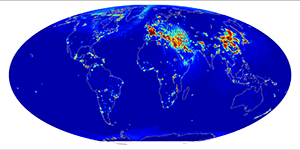
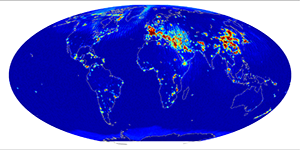
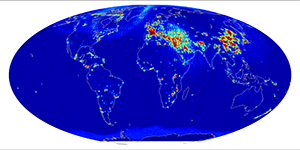
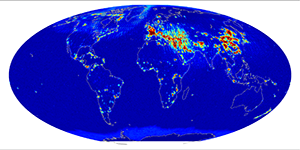
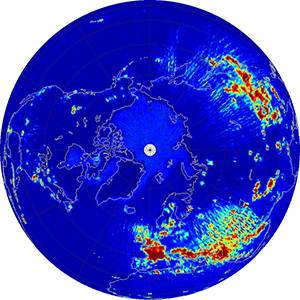
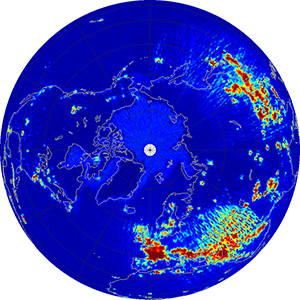
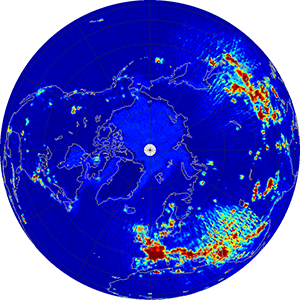
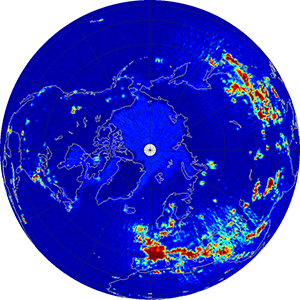
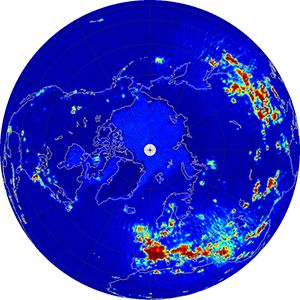
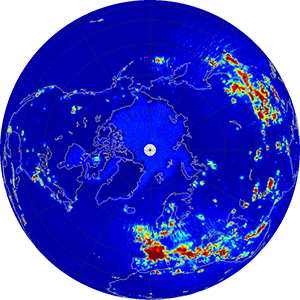
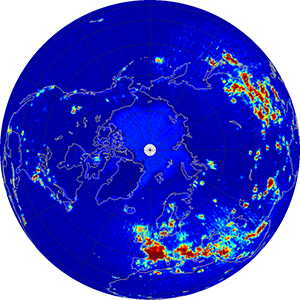
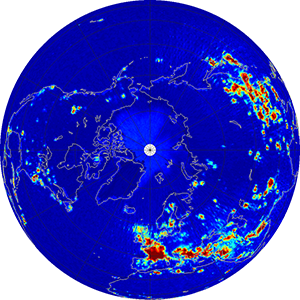
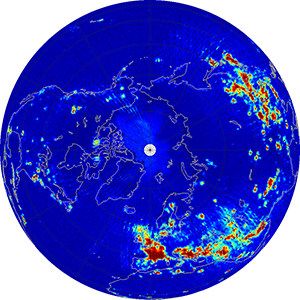
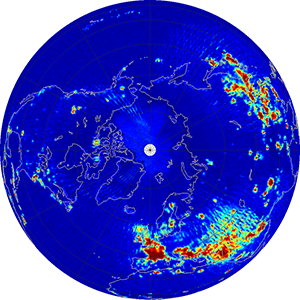
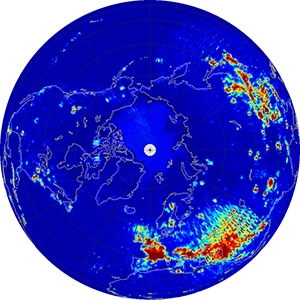
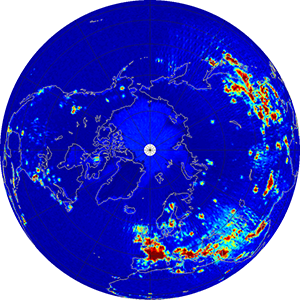
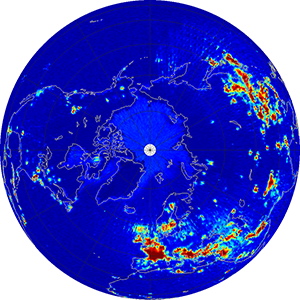
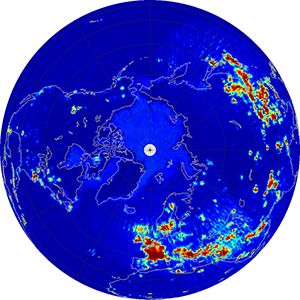
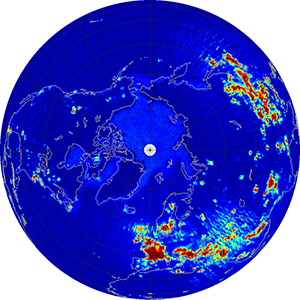
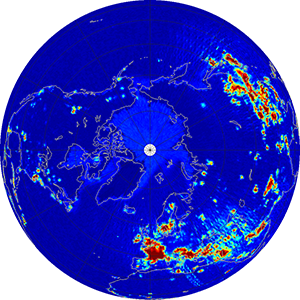
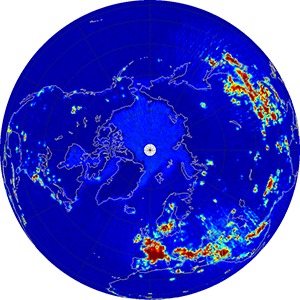
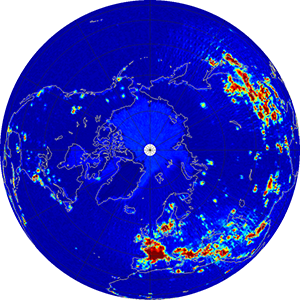
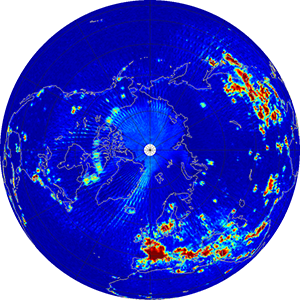
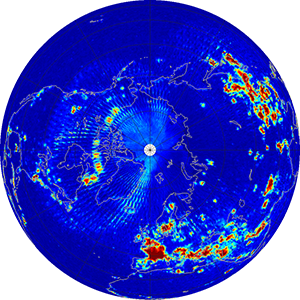
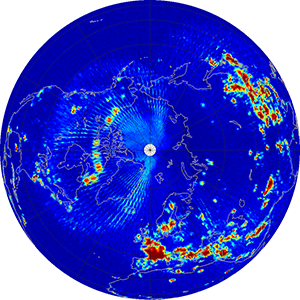
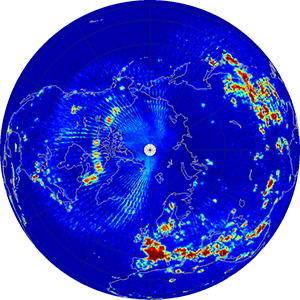
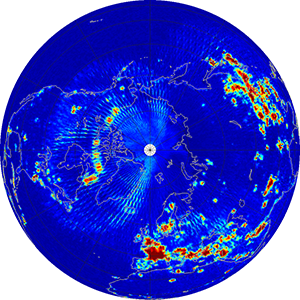
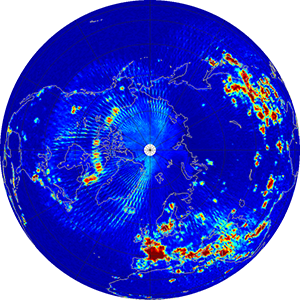
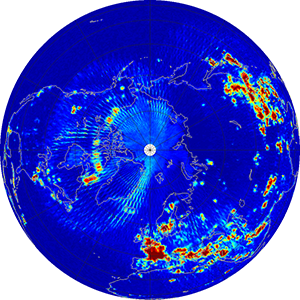
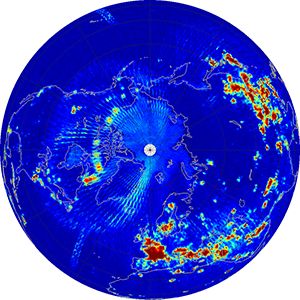
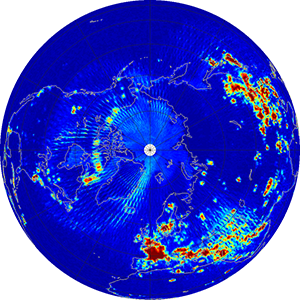
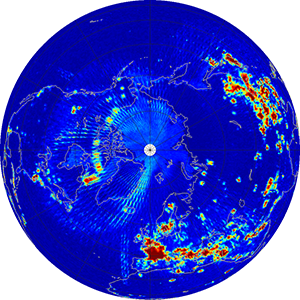
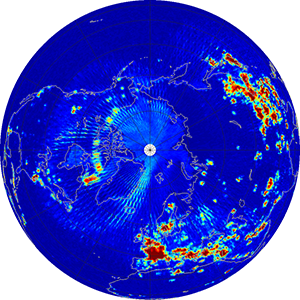
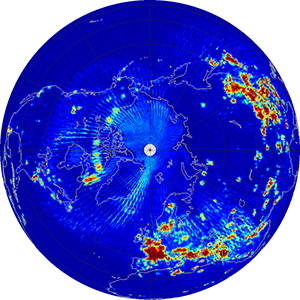
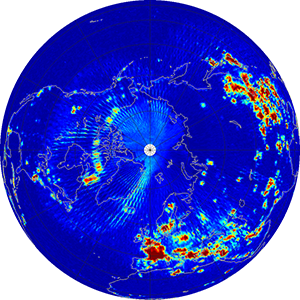
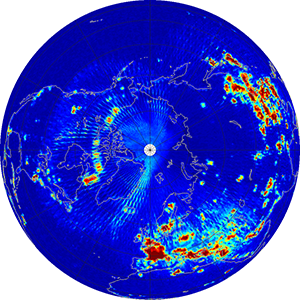
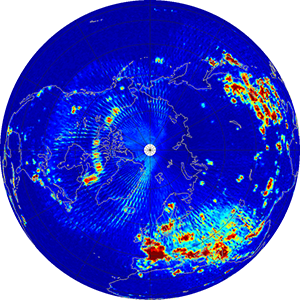
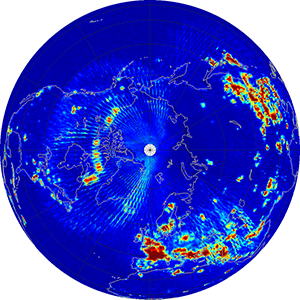
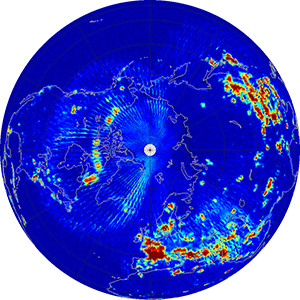
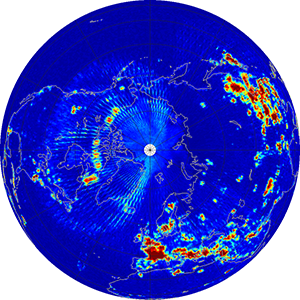
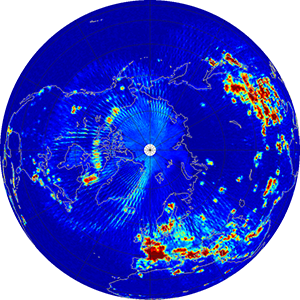
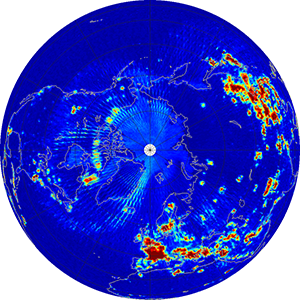
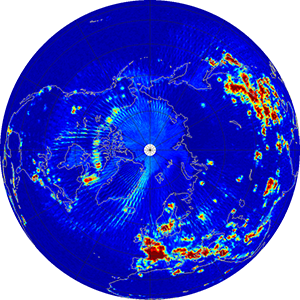
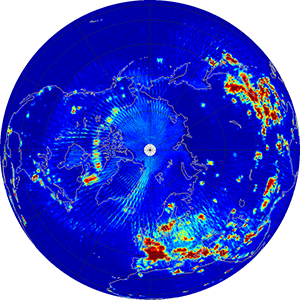
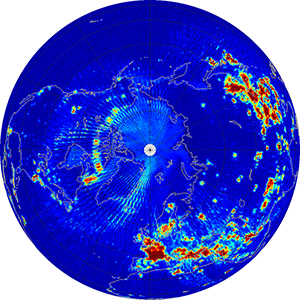
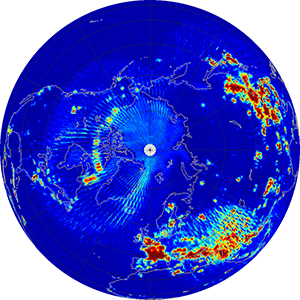
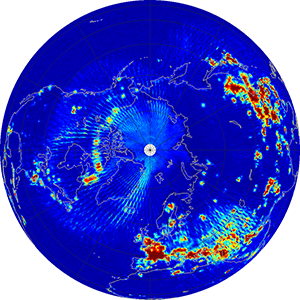
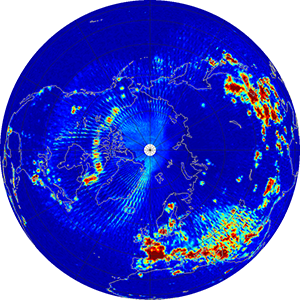
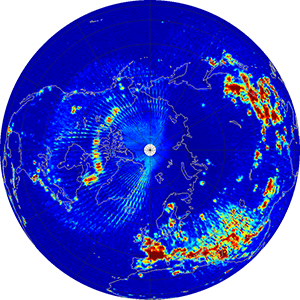
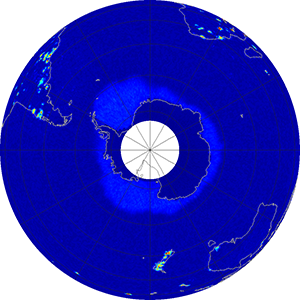
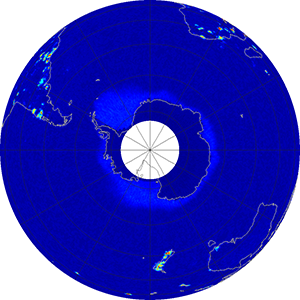
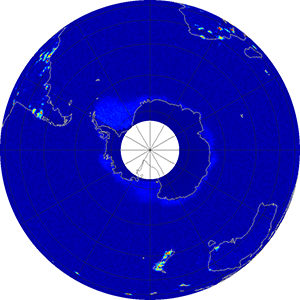
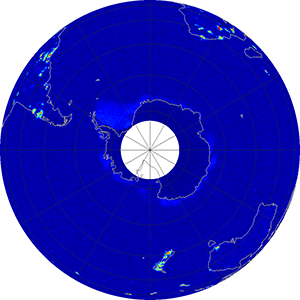
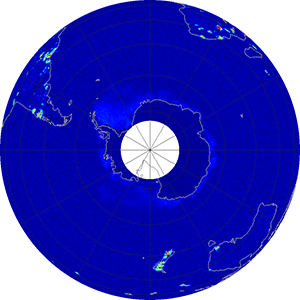
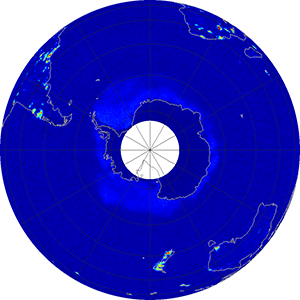
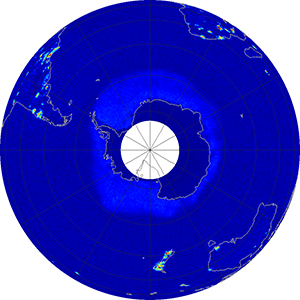
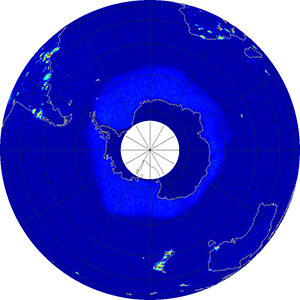
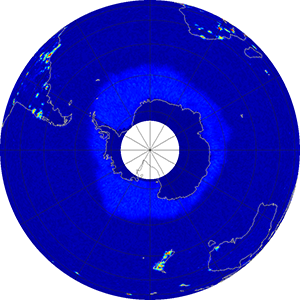
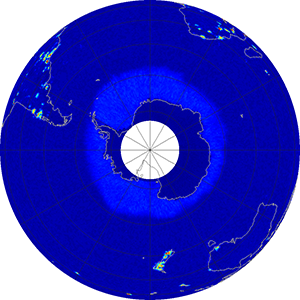
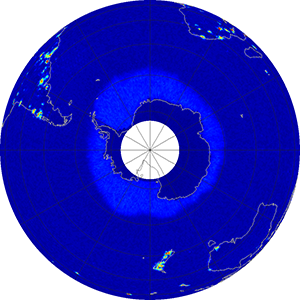
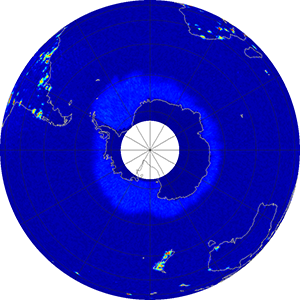
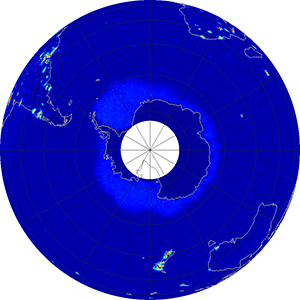
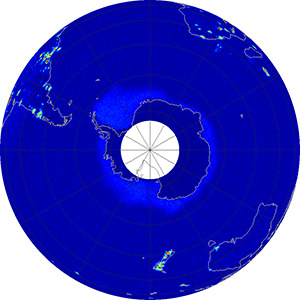
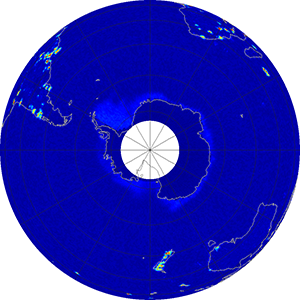
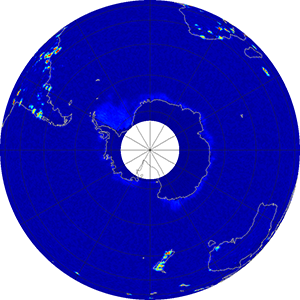
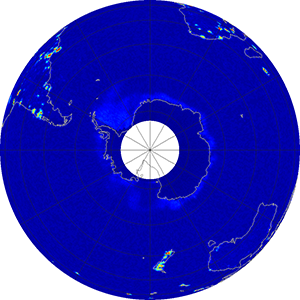
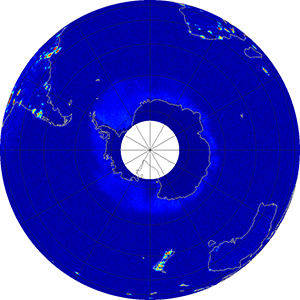
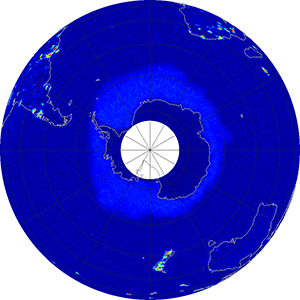
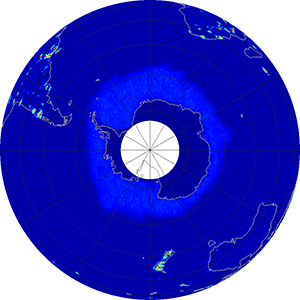
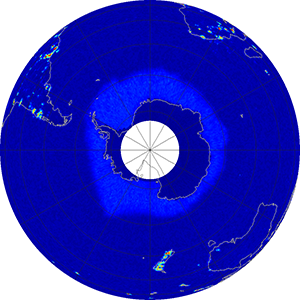
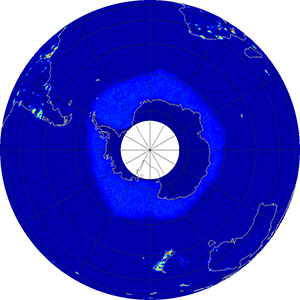
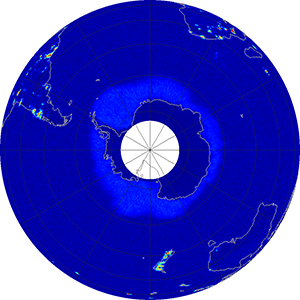
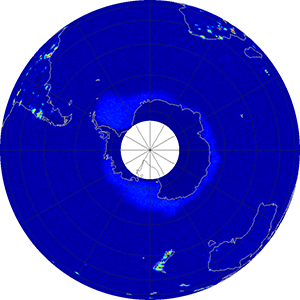
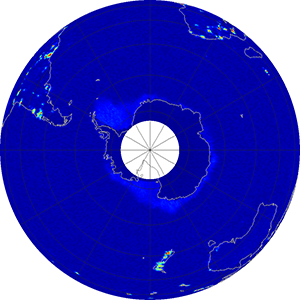
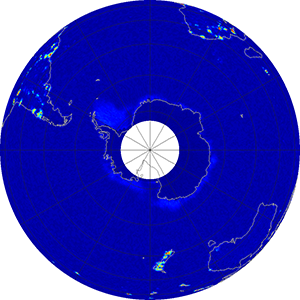
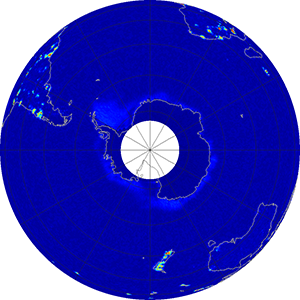
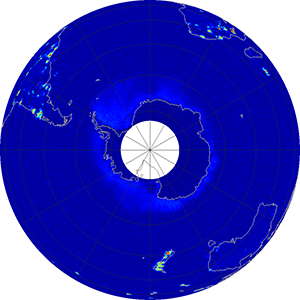
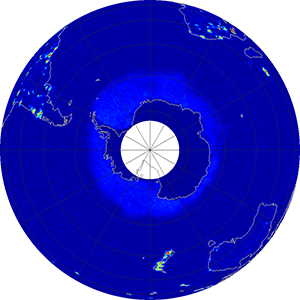
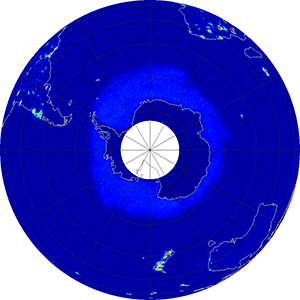
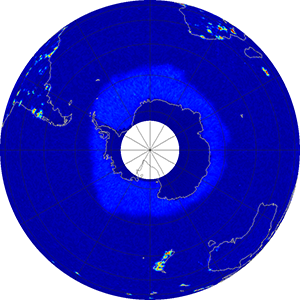
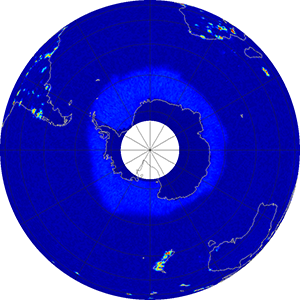
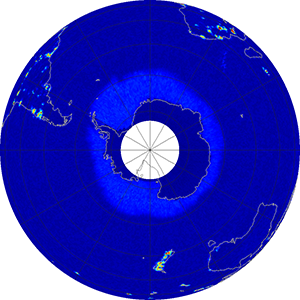
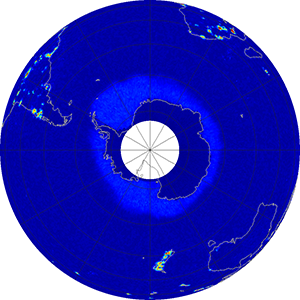
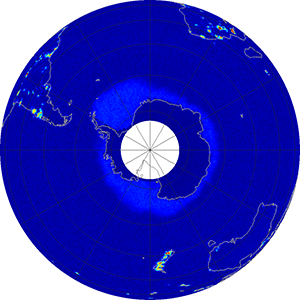
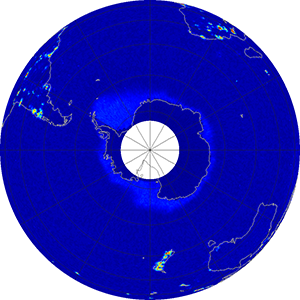
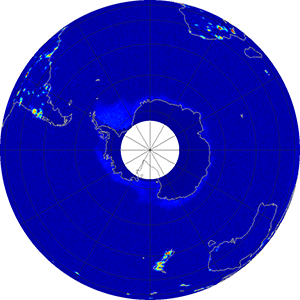
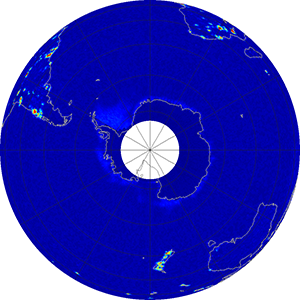
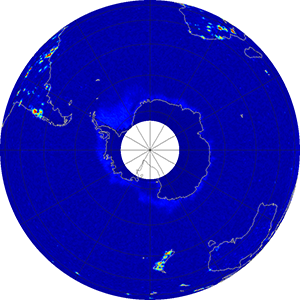
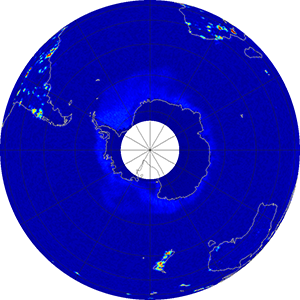
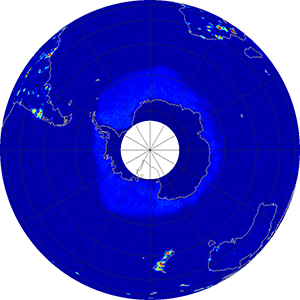
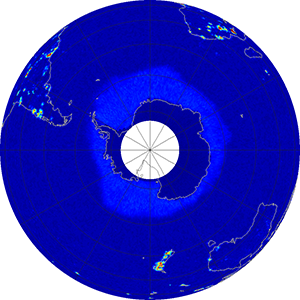
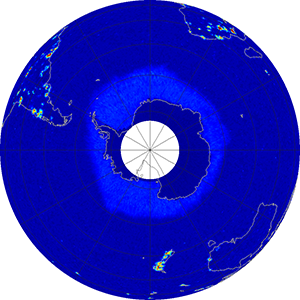
The images below (click to enlarge) show global monthly RFI for ascending/descending passes as detected by the radiometers.
The data are presented in three different projections (Mollweide, Orthographic Northern Hemisphere, and Orthographic Southern Hemisphere) in the 1400-1.427 GHz band, the frequency of the three Aquarius radiometers.
Maps showing data collected only during ascending (northward) passes and descending (southward) passes of the satellite are also available.
Maps in Plate Carrée projection are available upon request.
Each data point represents the average radiometer measurements over 1.44 seconds (the fundamental data block in Aquarius Level 2 data). Measurements identified as RFI are removed from processing and not used to calculate salinity. The color scale indicates the percentage of radiometer measurements within this window that are identified as RFI by the RFI detection algorithm (Le Vine, et al., 2014). Red colors indicate areas where over 80% of the sampled data are flagged for RFI presence. Dark blues show relatively little detected RFI, with less than about 10% of samples flagged in these regions. An additional RFI flag is used to identify locations where the measured brightness temperature over land exceeds the expected limits of surface emissivity (Soldo et al., 2017). This flag is not used to remove samples from further processing, but in generating the RFI maps, 100% RFI is assigned to data points where this flag is raised. The lighter blue areas in the polar regions are an artifact of the particular processing used to detect RFI which is based on the standard deviation of the measurements within the 1.44-second averaging window. The processor identifies as RFI samples that show a relatively large deviation from average even if they are not affected by RFI. This effect, usually referred to as false alarms, has been accounted for by using different RFI algorithm parameters on ocean and land, but it is still present on sea ice whose constantly changing extent makes a tuning of the algorithm parameters over it unpractical.
Despite the fact that the Aquarius radiometers operated within a band designated for scientific research where all radio frequency emissions are prohibited (i.e. the window at 1.413 GHz), RFI was still detected (Le Vine and de Matthaeis, 2014). This is especially true over land. Since L-band radiometers have been operational in space (e.g. SMOS, Aquarius and SMAP) many sources have been identified and mitigated. However, RFI at L-band is still a problem in many parts of the world.
Le Vine, D. and de Matthaeis, P. (2014). Aquarius Active/Passive RFI Environment at L-band, IEEE T. Geosci. Remote Let, 11 (10), 1747-1751.
Soldo, Y., Le Vine, D.M., de Matthaeis, P. and Richaume, P., 2017. L-Band RFI Detected by SMOS and Aquarius. IEEE T. Geosci. Remote, 55 (7), 4220-4235.
Images are provided by Paolo de Matthaeis and Yan Soldo, NASA Goddard Space Flight Center.
Each data point represents the average radiometer measurements over 1.44 seconds (the fundamental data block in Aquarius Level 2 data). Measurements identified as RFI are removed from processing and not used to calculate salinity. The color scale indicates the percentage of radiometer measurements within this window that are identified as RFI by the RFI detection algorithm (Le Vine, et al., 2014). Red colors indicate areas where over 80% of the sampled data are flagged for RFI presence. Dark blues show relatively little detected RFI, with less than about 10% of samples flagged in these regions. An additional RFI flag is used to identify locations where the measured brightness temperature over land exceeds the expected limits of surface emissivity (Soldo et al., 2017). This flag is not used to remove samples from further processing, but in generating the RFI maps, 100% RFI is assigned to data points where this flag is raised. The lighter blue areas in the polar regions are an artifact of the particular processing used to detect RFI which is based on the standard deviation of the measurements within the 1.44-second averaging window. The processor identifies as RFI samples that show a relatively large deviation from average even if they are not affected by RFI. This effect, usually referred to as false alarms, has been accounted for by using different RFI algorithm parameters on ocean and land, but it is still present on sea ice whose constantly changing extent makes a tuning of the algorithm parameters over it unpractical.
Despite the fact that the Aquarius radiometers operated within a band designated for scientific research where all radio frequency emissions are prohibited (i.e. the window at 1.413 GHz), RFI was still detected (Le Vine and de Matthaeis, 2014). This is especially true over land. Since L-band radiometers have been operational in space (e.g. SMOS, Aquarius and SMAP) many sources have been identified and mitigated. However, RFI at L-band is still a problem in many parts of the world.
References
Le Vine, D.M., de Matthaeis, P., Ruf, C.S., and Chen, D.D. (2014). Aquarius RFI Detection and Mitigation Algorithm: Assessment and Examples, IEEE T. Geosci. Remote, 52 (8).
Le Vine, D. and de Matthaeis, P. (2014). Aquarius Active/Passive RFI Environment at L-band, IEEE T. Geosci. Remote Let, 11 (10), 1747-1751.
Soldo, Y., Le Vine, D.M., de Matthaeis, P. and Richaume, P., 2017. L-Band RFI Detected by SMOS and Aquarius. IEEE T. Geosci. Remote, 55 (7), 4220-4235.
Images are provided by Paolo de Matthaeis and Yan Soldo, NASA Goddard Space Flight Center.

Global (Mollweide Projection)
May 2015 | April 2015 | March 2015 | February 2015 | |||
January 2015 | December 2014 | November 2014 | October 2014 | |||
September 2014 | August 2014 | July 2014 | June 2014 | |||
May 2014 | April 2014 | March 2014 | February 2014 | |||
January 2014 | December 2013 | November 2013 | October 2013 | |||
September 2013 | August 2013 | July 2013 | June 2013 | |||
May 2013 | April 2013 | March 2013 | February 2013 | |||
January 2013 | December 2012 | November 2012 | October 2012 | |||
September 2012 | August 2012 | July 2012 | June 2012 | |||
May 2012 | April 2012 | March 2012 | February 2012 | |||
January 2012 | December 2011 | November 2011 | October 2011 | |||
September 2011 | ||||||
Northern Hemisphere
May 2015 | April 2015 | March 2015 | February 2015 | |||
January 2015 | December 2014 | November 2014 | October 2014 | |||
September 2014 | August 2014 | July 2014 | June 2014 | |||
May 2014 | April 2014 | March 2014 | February 2014 | |||
January 2014 | December 2013 | November 2013 | October 2013 | |||
September 2013 | August 2013 | July 2013 | June 2013 | |||
May 2013 | April 2013 | March 2013 | February 2013 | |||
January 2013 | December 2012 | November 2012 | October 2012 | |||
September 2012 | August 2012 | July 2012 | June 2012 | |||
May 2012 | April 2012 | March 2012 | February 2012 | |||
January 2012 | December 2011 | November 2011 | October 2011 | |||
September 2011 | ||||||
Southern Hemisphere
May 2015 | April 2015 | March 2015 | February 2015 | |||
January 2015 | December 2014 | November 2014 | October 2014 | |||
September 2014 | August 2014 | July 2014 | June 2014 | |||
May 2014 | April 2014 | March 2014 | February 2014 | |||
January 2014 | December 2013 | November 2013 | October 2013 | |||
September 2013 | August 2013 | July 2013 | June 2013 | |||
May 2013 | April 2013 | March 2013 | February 2013 | |||
January 2013 | December 2012 | November 2012 | October 2012 | |||
September 2012 | August 2012 | July 2012 | June 2012 | |||
May 2012 | April 2012 | March 2012 | February 2012 | |||
January 2012 | December 2011 | November 2011 | October 2011 | |||
September 2011 | ||||||


