Science: Initial Measurements
| How Does Aquarius Measure Salinity? |
|---|
| The Aquarius instrument measured the ocean's surface microwave emission at 1.413 GHz (in the L-band portion of the spectrum protected for radio astronomy). The emissivity - measured as a parameter called brightness temperature - is modulated by the electrical conductivity of seawater, hence salinity. The seawater microwave signature comes from the top centimeter (0.4 inch) of the ocean surface. In addition to this passive measurement, Aquarius also measured radar backscatter at 1.26 GHz, to mitigate the emissivity variations due to ocean surface roughness, the largest uncertainty term in the salinity retrieval error budget. |
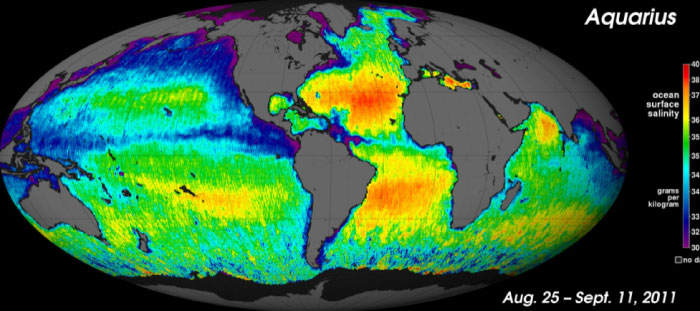
Early Results
Between late August 2011 and June 8, 2015, Aquarius continuously collected and distributed data, allowing scientists to study changes
in salinity associated with water cycle events such as major storms and river outflows. Interestingly, given Aquarius's
relatively large viewing footprint - 150 square kilometers (93 square miles) - and associated potential for contamination by
the strong signal from land areas, scientists have been pleasantly surprised by the instrument's ability to detect coastal
ocean salinity features. For example, within 10 days of its first data collection, Aquarius imaged a strong low-salinity
region in the Gulf of Mexico, just east of the Mississippi River Delta, that disappeared by late October 2011. Scientific
analysis indicates that this temporary freshening of the Gulf was associated with
Tropical Storm Lee that made landfall
over New Orleans in early September 2011. The storm caused a surge of fresh-water river discharge from the Mississippi,
as well as heavy rainfall directly over the sea surface that decreased the surface salinity in this region. Click
here to view monthly composite maps of Aquarius data.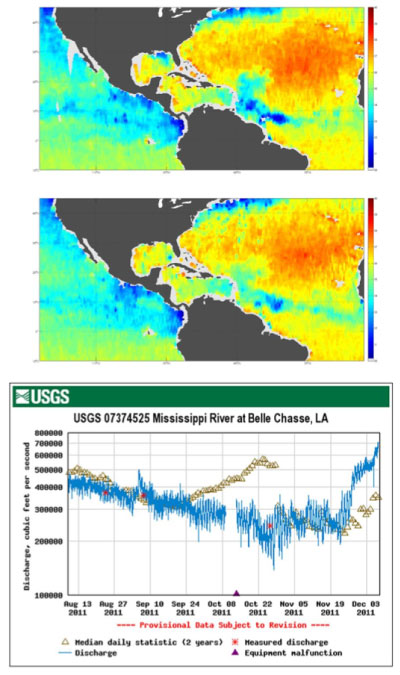
Unexpected Outcomes: Amazon Plume
The sequence of monthly salinity maps of the tropical Atlantic Ocean from September to November 2011 (click on image at left)
showed another unexpected early discovery using Aquarius data — namely, a large amount of freshwater input from the Amazon
and Orinoco Rivers. The Amazon River empties into the Atlantic Ocean along the Equator, discharging freshwater from the largest
watershed on Earth. The mouth of the Orinoco, one of the longest rivers in South America, is located in Venezuela at
about 8.6° N latitude. Aquarius data have revealed that during these months the river plumes appeared to merge
together and were carried eastward by the North Atlantic Counter Current. This time period also coincided with high
rainfall over the tropical Atlantic, which likely contributed to the large freshwater signal at the ocean surface.
Scientists continue to observe salinity trends in this and other regions, particularly in terms of how seasonal
variations in rainfall and river output are tied to changes in ocean circulation.Improving Measurement Capabilities
The Aquarius team continues to work on retrieving ocean surface salinity data closer to the coasts and poles. Land and ice emit very
bright microwave emissions that swamp the signal read by the satellite. At the poles, there's the added complication that cold polar
waters require very large changes in their salt concentration to modify their microwave signal. Another factor that affects salinity
readings is intense rainfall. Heavy rain can affect salinity readings by attenuating the microwave signal that Aquarius read off the
ocean surface as it traveled through the soaked atmosphere. Rainfall can also create roughness and shallow pools of fresh water on the
ocean surface. In the future, the Aquarius team will use data collected by another instrument aboard Aquarius/SAC-D — the Argentine-built
Microwave Radiometer — to gauge the presence of intense rain simultaneously to salinity readings, so that scientists can flag data collected
during heavy rainfall.Want to learn more?
- Aquarius/SAC-D Science Team Meeting presentations (Seattle, July 2010)
- Aquarius PI Gary Lagerloef's Plenary Presentation at the AGU Ocean Sciences Meeting (February 2010)
- Oceanography: Special Issue on the Future of Oceanography from Space (December 2010)
- Oceanography: Special Issue on Salinity (March 2008)