Gallery
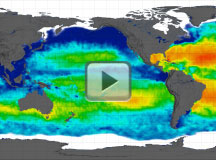
Aquarius Sea Surface Salinity Flat Maps 2012 (00:00:12)
[01-Mar-13] This visualization celebrates over a year of successful Aquarius observations. Sea surface salinity is shown on a flat map using a simple cartesian and extended Molleide projections. Versions are included with and without dates/color bars.The range of time shown is December 2011 through December 2012. The data continuously loops through this range every 6 seconds. This visualization was generated based on version 2.0 of the Aquarius data products with all 3 scanning beams. Credit: Norman Kuring, NASA Goddard Space Flight Center.
Original Movie: https://svs.gsfc.nasa.gov/vis/a000000/a004000/a004050/