Gallery: Sea Surface Salinity
Composite Maps of SMAP Data (V2.0)
NASA's Soil Moisture Active Passive (SMAP) mission began collecting sea surface salinity data in April 2015, overlapping with Aquarius observations for approximately three months. Using the same frequency as Aquarius (L-band; 1.41 GHz), SMAP's global salinity measurements continue the time series that began with Aquarius in August 2011.
Read more about differences between Aquarius and SMAP
Read more about differences between Aquarius and SMAP
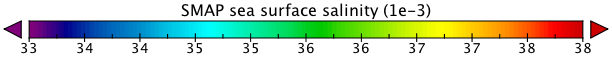
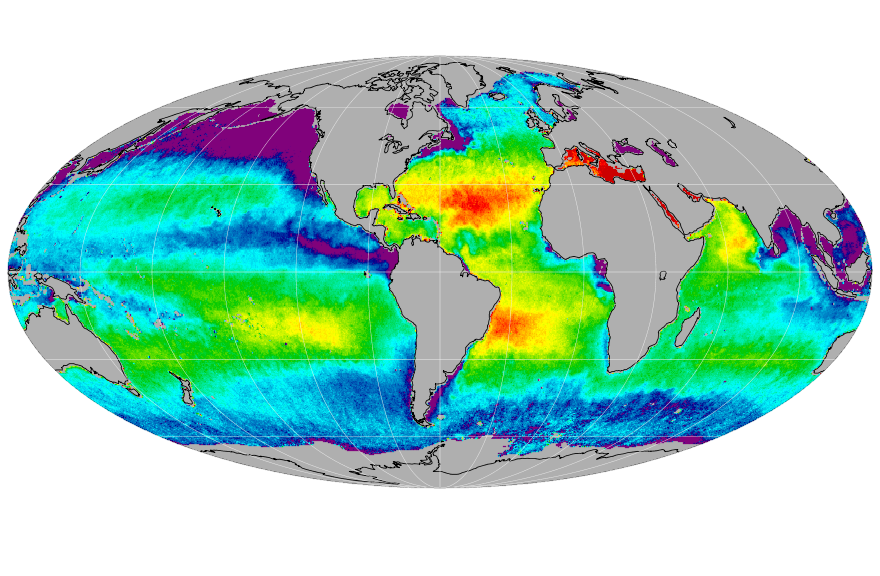
The maps below are generated from Version 2.0 (V2.0) of the SMAP sea surface salinity Level-3 (mapped) data. These monthly averaged data are gridded at 25 x 25 km (15.5 X 15.5 mi) resolution. They show a range of salinities from 33 to 38 using the Practical Salinity Scale (PSS; Lewis, 1980), which is roughly equivalent to parts per thousand. PSS and PSU (Practical Salinity Units, which is also used), are different names for the same thing.
Dark blues and purples represent lower salinities while reds show areas of higher sea surface salinity. It is important to note that the color scale used for the V2.0 SMAP salinity maps is not the same as the one used for Aquarius Version 4.0 maps. There are plans to implement a consistent color scale between these maps in conjunction with Aquarius Version 5.0 processing.
SMAP monthly sea surface salinity maps are available below in Mollweide (global), Northern Hemisphere and Southern Hemisphere projections. Click on any of the images below to see larger versions.
These monthly data, along with 8-day running mean sea surface salinities, are available from PO.DAAC.
Global (Mollweide Projection)
 December 2017 |  November 2017 |  October 2017 |  September 2017 | |||
 August 2017 |  July 2017 |  June 2017 |  May 2017 | |||
 April 2017 |  March 2017 |  February 2017 |  January 2017 | |||
 December 2016 |  November 2016 |  October 2016 |  September 2016 | |||
 August 2016 |  July 2016 |  June 2016 |  May 2016 | |||
 April 2016 |  March 2016 |  February 2016 |  January 2016 | |||
 December 2015 |  November 2015 |  October 2015 |  September 2015 | |||
 August 2015 |  July 2015 |  June 2015 |  May 2015 | |||
 April 2015 | ||||||
Northern Hemisphere
 December 2017 |  November 2017 |  October 2017 |  September 2017 | |||
 August 2017 |  July 2017 |  June 2017 |  May 2017 | |||
 April 2017 |  March 2017 |  February 2017 |  January 2017 | |||
 December 2016 |  November 2016 |  October 2016 |  September 2016 | |||
 August 2016 |  July 2016 |  June 2016 |  May 2016 | |||
 April 2016 |  March 2016 |  February 2016 |  January 2016 | |||
 December 2015 |  November 2015 |  October 2015 |  September 2015 | |||
 August 2015 |  July 2015 |  June 2015 |  May 2015 | |||
 April 2015 | ||||||
Southern Hemisphere
 December 2017 |  November 2017 |  October 2017 |  September 2017 | |||
 August 2017 |  July 2017 |  June 2017 |  May 2017 | |||
 April 2017 |  March 2017 |  February 2017 |  January 2017 | |||
 December 2016 |  November 2016 |  October 2016 |  September 2016 | |||
 August 2016 |  July 2016 |  June 2016 |  May 2016 | |||
 April 2016 |  March 2016 |  February 2016 |  January 2016 | |||
 December 2015 |  November 2015 |  October 2015 |  September 2015 | |||
 August 2015 |  July 2015 |  June 2015 |  May 2015 | |||
 April 2015 | ||||||