Gallery
Long-Term Composite Image: 28-Aug-11 to 29-Nov-11
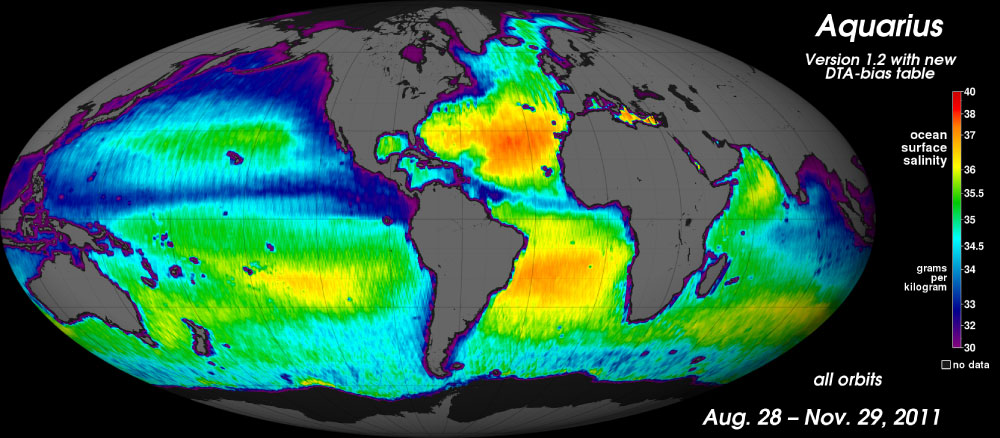
[29-Nov-11] Three-month average composite global image for the time period 28 August through 29 November 2011 using bias-drift corrected data. When compared to the initial 2.5-week average image released in September, the three-month average yields a much less noisy pattern which clearly shows major climatological salinity features and smaller scale structures. Credit: Norman Kuring, NASA GSFC.View: Click on the image to enlarge. Click on the Escape key or anywhere outside the shadowbox to close.
Download: To download a copy, right click on the image and select Save Image As (on a Mac keyboard, click the touchpad while holding down the Control key). To download the highest resolution in our database, first click on the image to enlarge and then save that version.