| What Are We Seeing in Aquarius Data? |
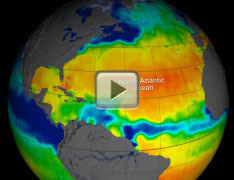
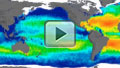
Aquarius data have revealed interesting features in the global ocean, including a salty patch of water in the North Atlantic
Ocean. Evaporation of water from this area leaves behind large amounts of salt, contributing to a high-salinity region.
Near the equator in the North Pacific Ocean, one of the wettest regions on the planet, heavy rainfall adds an abundance
of water to the sea surface. This results in a band of low salinity water off the coast of Central America.
Rivers also influence the amount of salt on the sea surface. At the mouth of the Amazon River, millions of gallons of
freshwater flow into the Atlantic Ocean, resulting in a plume of low-salinity water.
At high latitudes, the seasonal melting of sea ice causes a sharp decrease in sea surface salinity. In spring and summer,
surface currents in the Labrador Sea transport low salinity water south, where it meets warmer, saltier water carried
north by the Gulf Stream.
The waters surrounding the Indian subcontinent vary in salinity due to geography and climate. To the west, an arid
climate and lack of freshwater input yields the salty Arabian Sea. To the east, monsoon rains and freshwater outflow
from the Ganges River keep the Bay of Bengal far less salty.
Without satellite observations, these global changes would be largely invisible to us. Aquarius data are helping
scientists to better understand our vast ocean, including how changes in ocean circulation and the water cycle may
impact Earth's climate. |
Salt. Most people view it first and foremost as the most common condiment. It comes in many forms and has thousands of uses, from preserving
food to manufacturing pharmaceuticals. But salt also plays an important role in how the Earth system functions. And just as salt flows through
our veins, it also flows through Earth's ocean, the lifeblood of Earth's climate system. The ocean is roughly 3.5% salt and the
concentration of dissolved salts in the ocean is referred to as salinity, which varies across the globe and over time.
Just as too much or too little salt in our diets affects our health, so too do high and low salinity have profound effects on how the ocean
circulates, how freshwater cycles around Earth and how our climate works. The concentration of salt on the ocean surface — the part of the
ocean that actively exchanges water and heat with Earth's atmosphere — is a critical driver of ocean processes and climate variability.
To better understand the regional and global processes that link variations in ocean salinity to changes in the global water cycle - and how
these variations influence ocean circulation and climate - NASA built and
launched Aquarius, the primary instrument aboard the
international Aquarius/Satélite de Aplicaciones Científicas (SAC)-D observatory.
Aquarius made NASA's first space-based global observations of ocean surface salinity, flying 657 kilometers (408 miles) above Earth in
a sun-synchronous polar orbit that repeated every seven days. This NASA Earth System Science Pathfinder mission mapped global changes in
ocean surface salinity with a resolution of 150 kilometers (93 miles), showing how salinity changes from month to month, season to season
and year to year. Scientists are combining Aquarius data with in-water measurements to generate operational maps of ocean salinity
distribution.
The Aquarius/SAC-D mission was developed collaboratively between NASA and Argentina's space agency, Comisión Nacional de Actividades Espaciales
(CONAE) to best meet the goals of each agency while giving priority to salinity measurements. CONAE built complementary sensors to detect
rain, sea ice, and wind speed, plus sea surface temperature sampling. CONAE-sponsored instruments — including sensors from the French Space
Agency (Centre National d'Etudes Spatiales, CNES) and another from the Italian Space Agency (Agenzia Spaziale Italiana, ASI) — provide
environmental data for a wide range of applications, including natural hazards, land processes, epidemiological studies, and air quality
issues.
Key Facts About Sea Surface Salinity
and the Aquarius Instrument |
|---|
|
|
Want to learn more?