Gallery
Below is a collection of images, movies, podcasts, and slideshows relevant to the Aquarius mission. Click on the images for enlarged views or to play movies, podcasts, and slideshows. Click on the MORE links for additional information. To access maps produced from Aquarius data, click here.
Most Popular (4) | ||||||
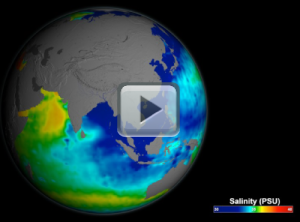
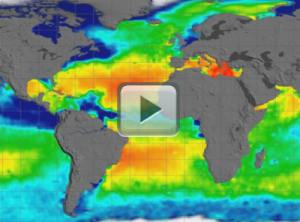
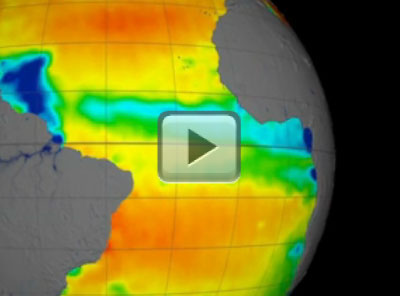
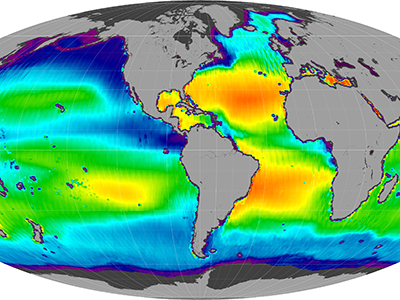
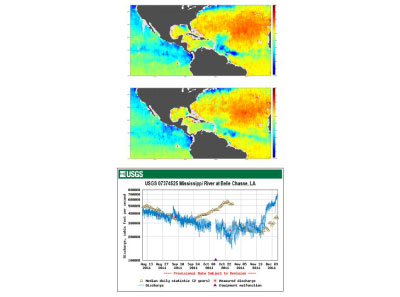
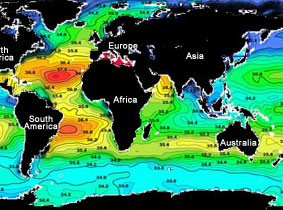
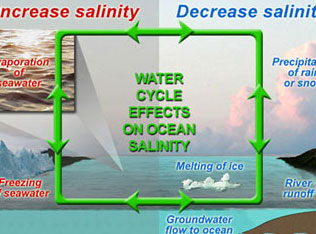
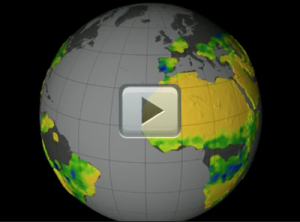
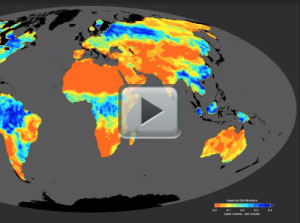
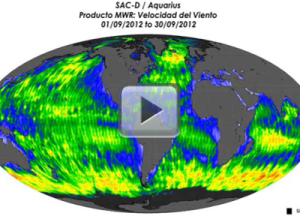
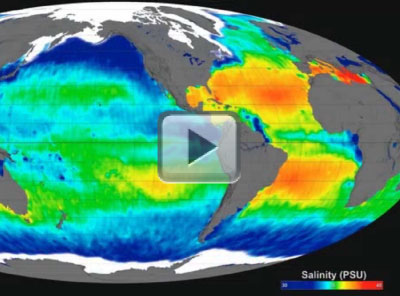
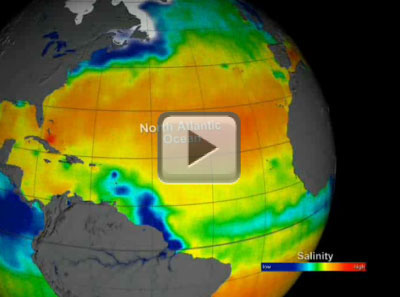
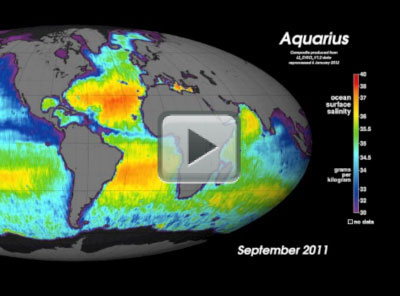
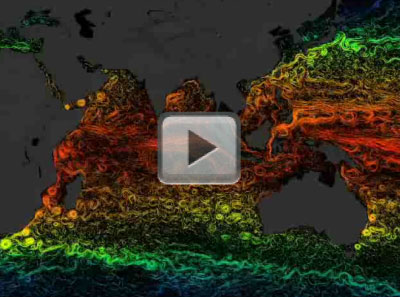
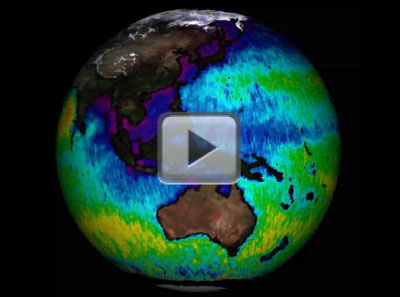
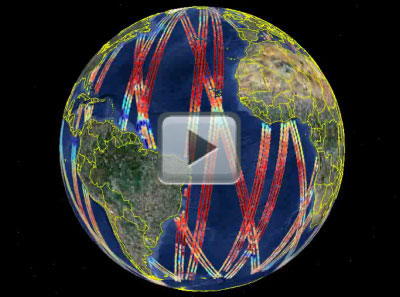
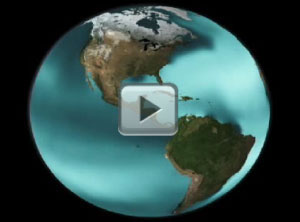
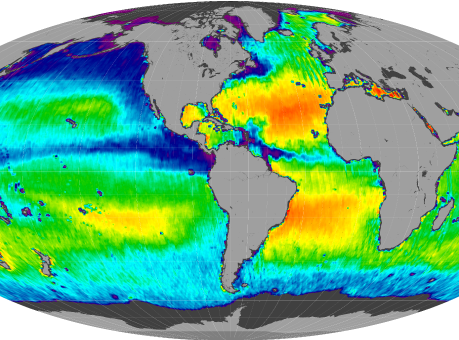
Aquarius Sea Surface Salinity, 2011-2014 (Rotating Globe) | Aquarius Sea Surface Salinity, 2011-2014 (Flat Map) | Changes in Global Sea Surface Salinity | Water Cycle Effects on Ocean Salinity | |||
Images (53) | ||||||
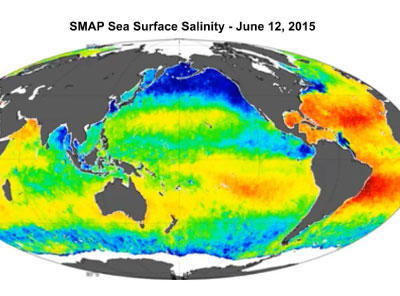
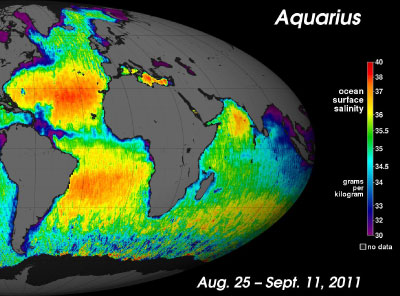
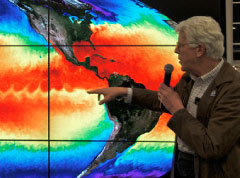
Composite Image: 25-Aug-11 to 05-May-15 | Aquarius Mission Composite Image: 25-Aug-11 to 05-May-15 | SMAP Sea Surface Salinity - June 12, 2015 | Aquarius at AGU 2015 - Hyperwall | |||
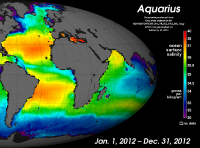
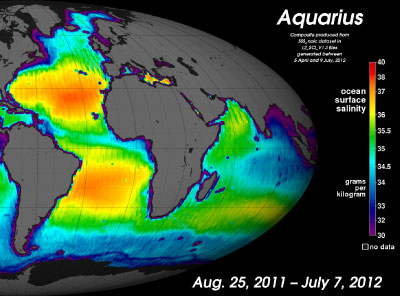
Long Term Composite Image: 01-Jan-12 to 31-Dec-12 | Aquarius/SAC-D Logo | Long-Term Composite Image: 25-Aug-11 to 07-Jul-12 | Aquarius Satellite Maps Ocean Salinity Structure | |||
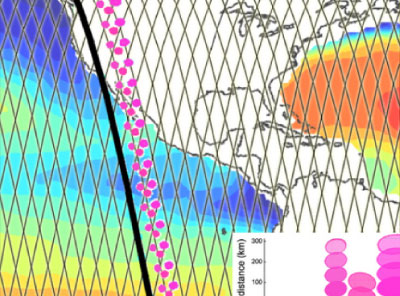
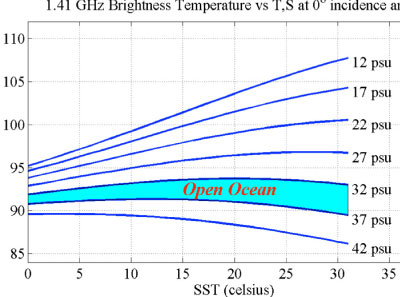
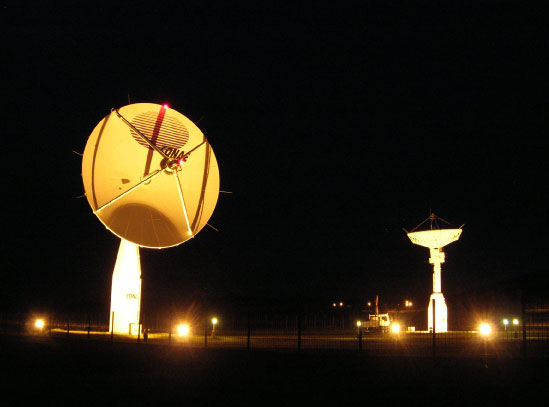
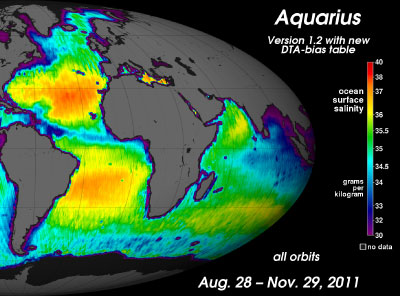
Aquarius/SAC-D Tracks | Brightness Temperature vs. Sea Surface Temperature | Ground Station in Córdoba, Argentina (View at Night) | Long-Term Composite Image: 28-Aug-11 to 29-Nov-11 | |||
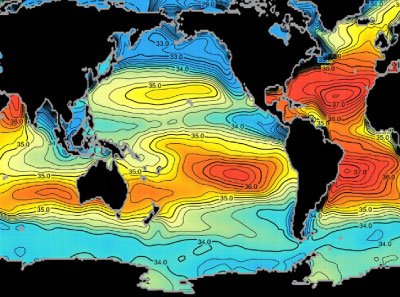
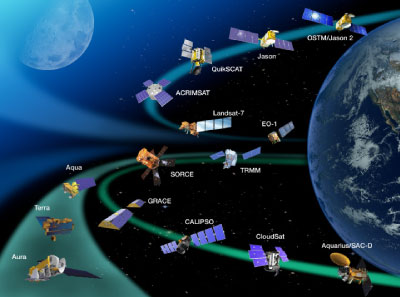
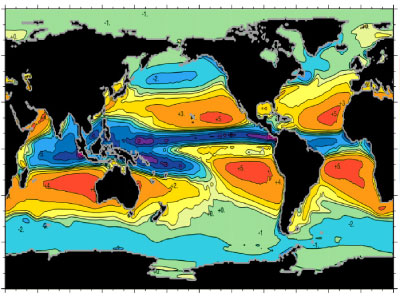
Comparison of Historical and Simulated Sea Surface Salinity | Average Salinity From Historical Ship and Buoy Data | The Earth Science Satellites of NASA (2011) | First Light Map | |||
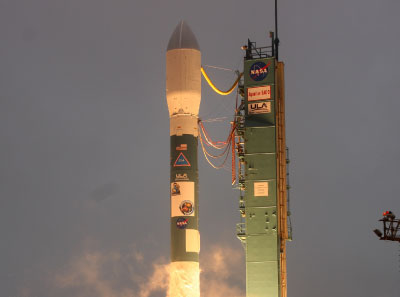
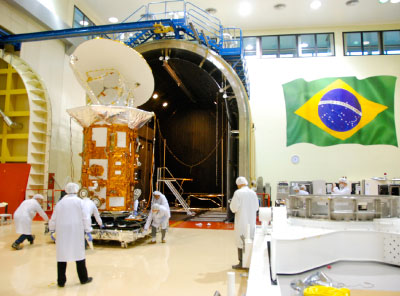
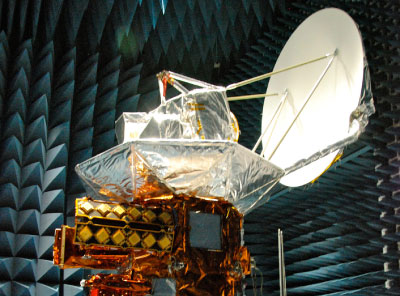
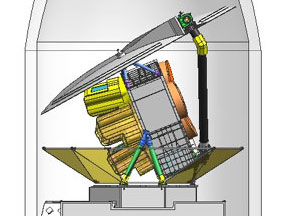
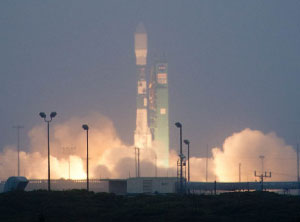
Launch of Aquarius/SAC-D Satellite | Aquarius/SAC-D Outside Environmental Test Chamber | Aquarius/SAC-D Inside Environmental Test Chamber | Aquarius/SAC-D Satellite in Launch Fairing | |||
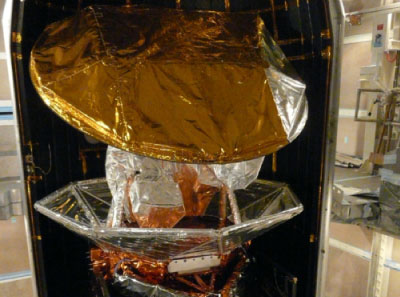
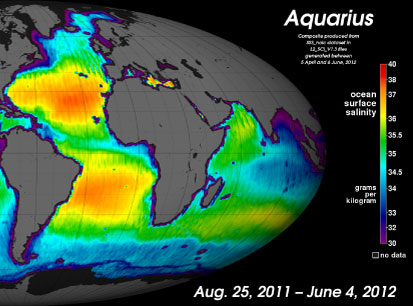
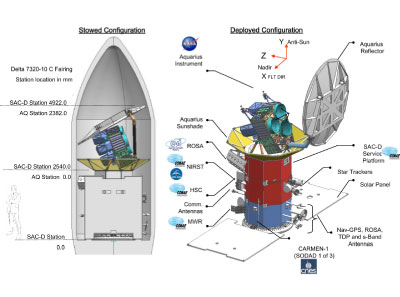
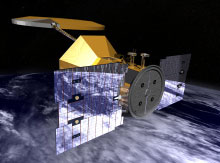
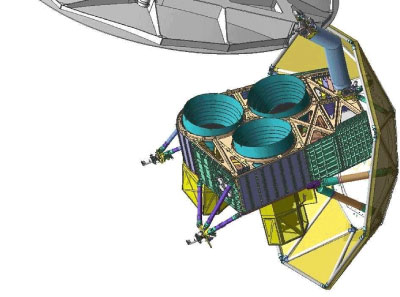
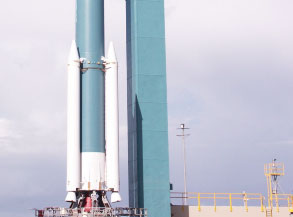
Aquarius Instrument at Vandenberg Air Force Base | Long-Term Composite Image: 25-Aug-11 to 04-Jun-12 | Aquarius/SAC-D - Stowed and Deployed Configurations | Aquarius Instrument | |||
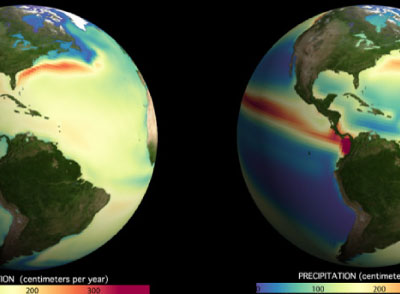
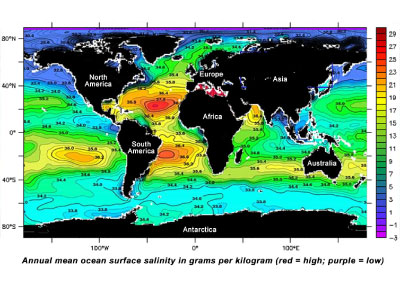
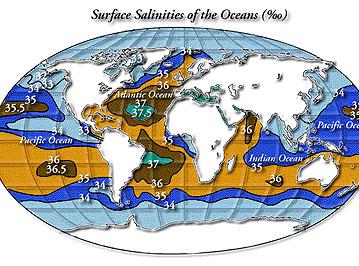
Evaporation and Precipitation in the Western Hemisphere | Annual Mean Surface Salinity Data | Visualization of Aquarius/SAC-D Solar Panels | Surface Salinities of the Oceans | |||
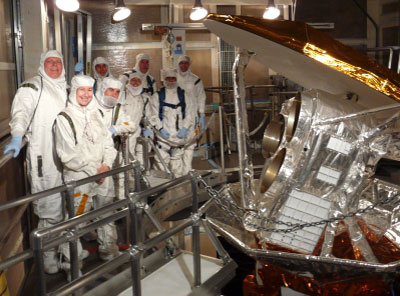
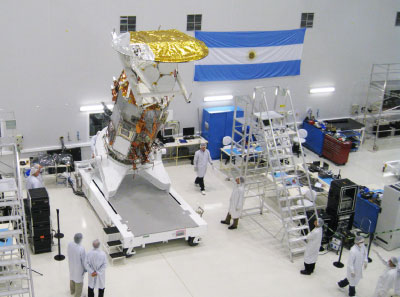
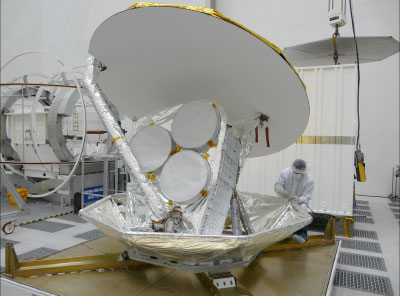
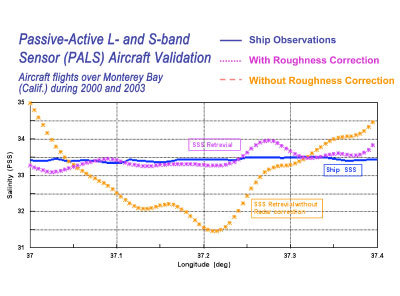
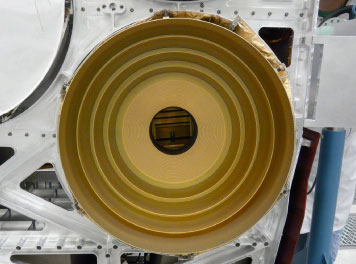
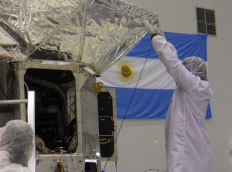
Aquarius/SAC-D in INVAP Clean Room | Aquarius Detects Possible Effects of Tropical Storm Lee | Aquarius Instrument in JPL Clean Room | Passive-Active L- and S-Band (PALS) Sensor - Aircraft Validation | |||
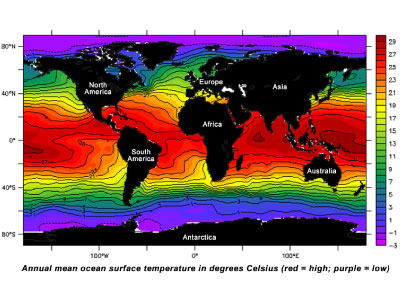
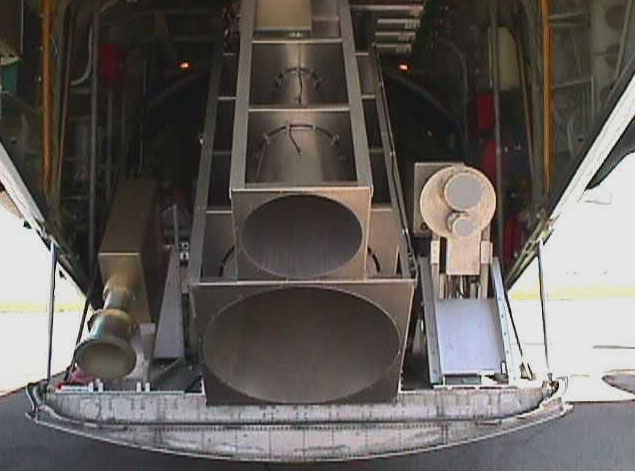
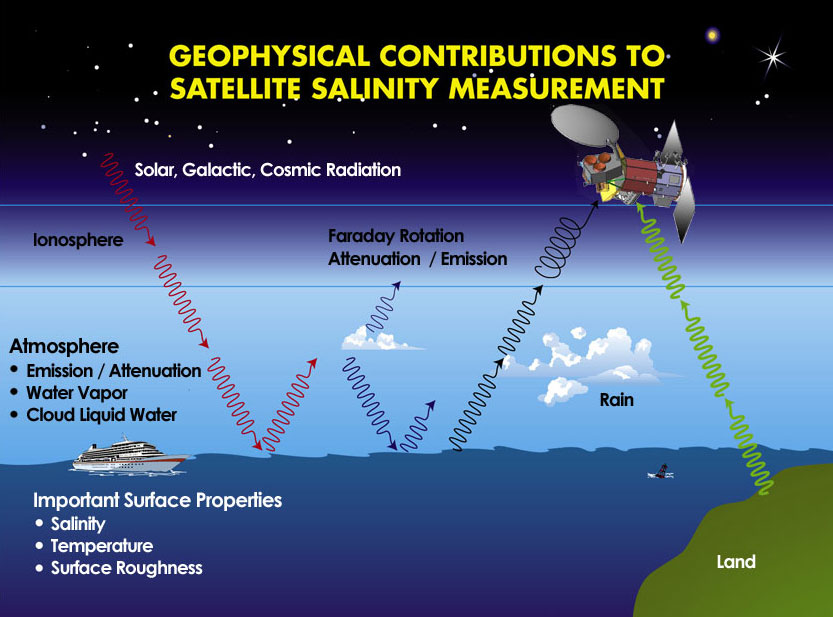
Global Sea Surface Temperature Values | Aquarius Prototype in C-130 | Geophysical Contributions to Satellite Salinity Measurements | Sea Surface Temperature of the Gulf Stream | |||
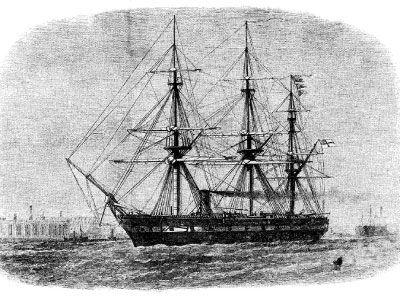
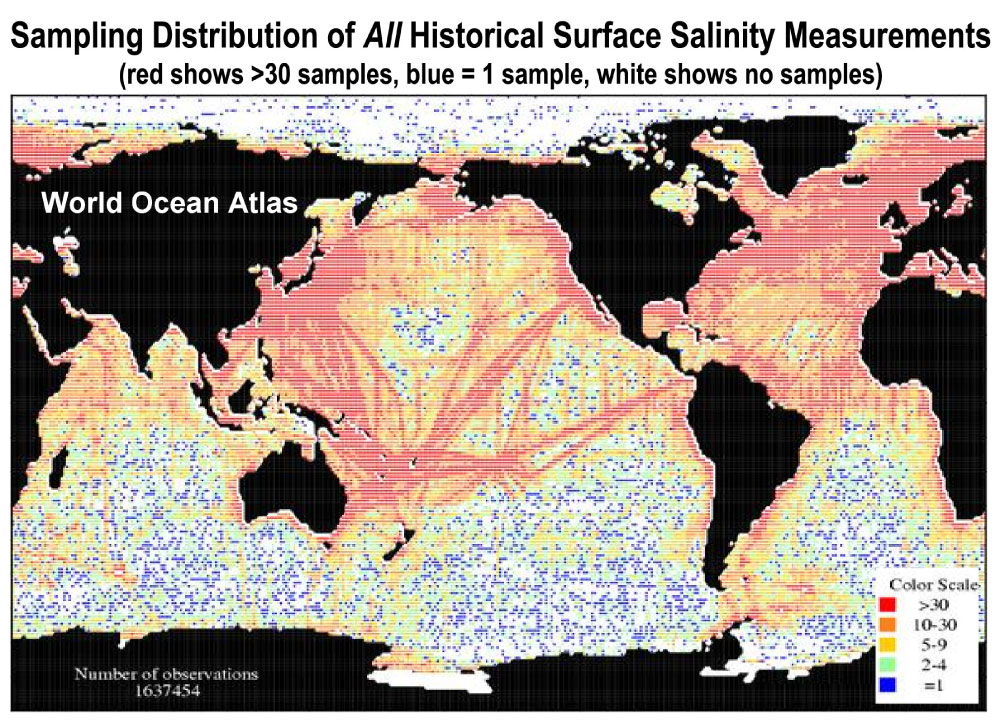
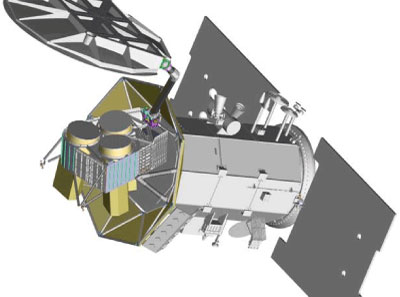
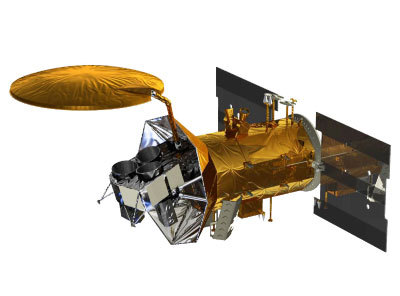
Artist Depiction of Aquarius/SAC-D Observatory in Orbit | Global Sea Surface Salinity Values | H.M.S Challenger | Historical Surface Salinity Measurements | |||
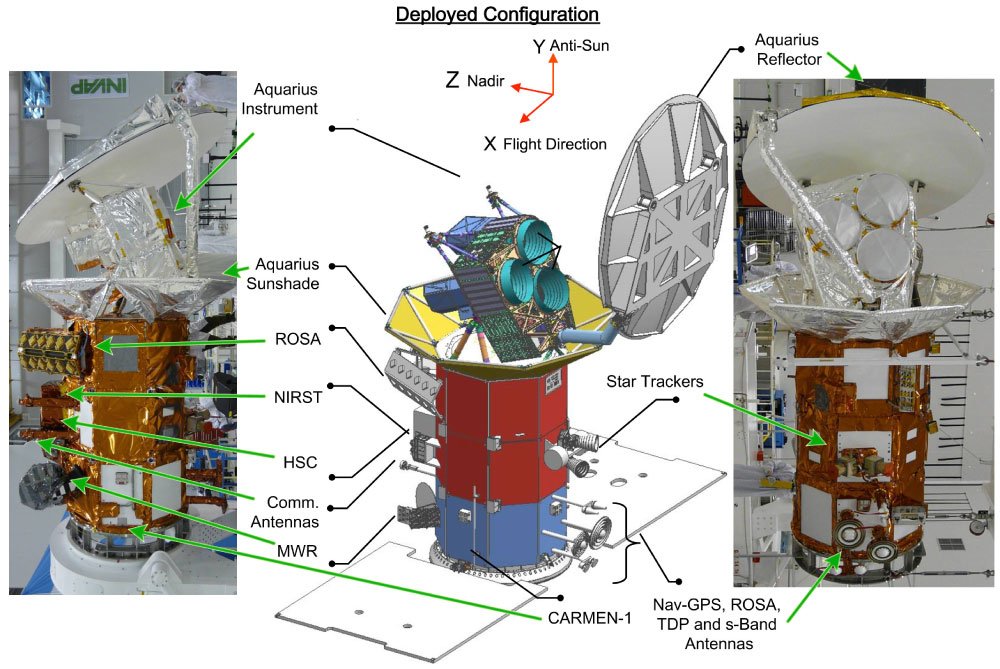
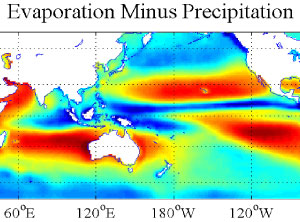
Water Cycle Effects on Ocean Salinity | Evaporation Minus Precipitation 1981-2002 | Aquarius/SAC-D Observatory Diagram | Schematic Diagram of Aquarius in Deploy-ready Mode | |||
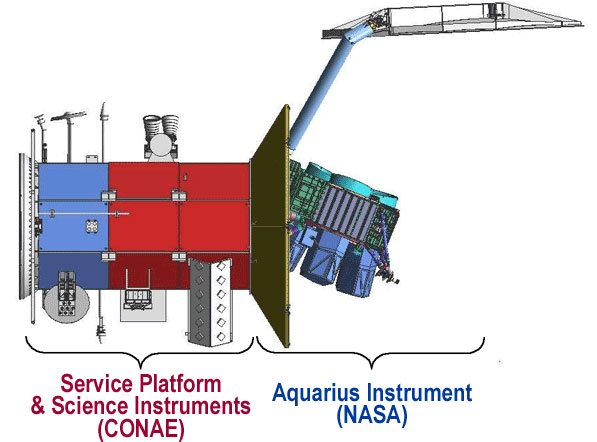
Average Evaporation Minus Precipitation | CONAE and NASA Components of the Aquarius/SAC-D Observatory | Aquarius Instrument Diagram | Aquarius Prototype, PALS | |||
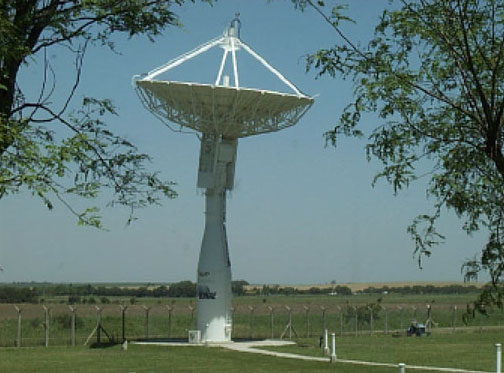
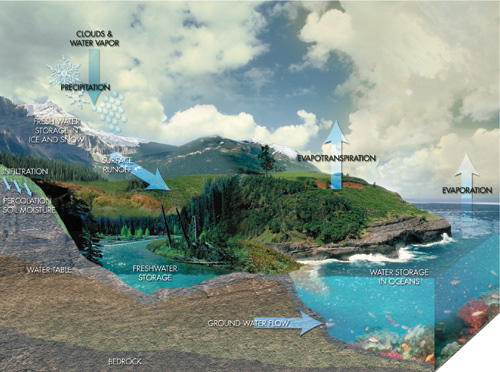
Mission Operations Center, Córdoba, Argentina | Command and Telemetry Antenna, Córdoba, Argentina | Water Cycle Diagram | Visualization of the Aquarius/SAC-D Spacecraft | |||
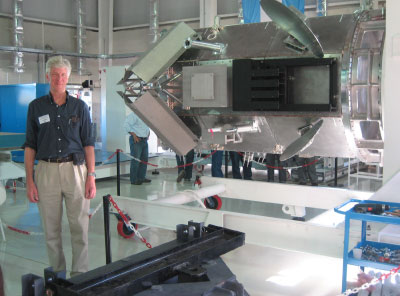
Aquarius PI Gary Lagerloef and the SAC-D Service Platform | ||||||
Movies (61) | ||||||
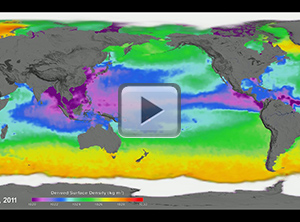
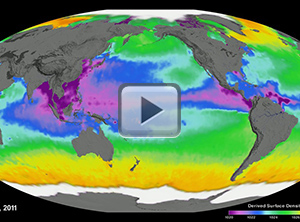
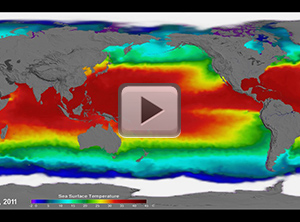
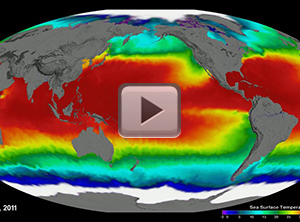
Aquarius Sea Surface Density | Aquarius Sea Surface Density (Mollweide) | Aquarius Sea Surface Temperature | Aquarius Sea Surface Temperature (Mollweide) | |||
Ocean Alkalinity, 2011 to 2015 | Aquarius Sea Surface Salinity, 2011-2015 (Mollweide) | Aquarius Sea Surface Salinity, 2011-2015 (Flat Map) | Aquarius Sea Surface Salinity, 2011-2014 (Rotating Globe) | |||
Aquarius Sea Surface Salinity, 2011-2014 (Flat Map) | Aquarius Soil Moisture | Aquarius Soil Moisture (Narrated) | Aquarius Soil Moisture | |||
Seasonal Variation of Wind Speed | KCTS Interview with Gary Lagerloef, Part 2 | KCTS Interview with Gary Lagerloef, Part 5 | KCTS Interview with Gary Lagerloef, Part 4 | |||
KCTS Interview with Gary Lagerloef, Part 3 | KCTS Interview with Gary Lagerloef, Part 1 | Composite Movie Showing the First Year of Aquarius Data | Aquarius Sea Surface Salinity Flat Maps 2012 | |||
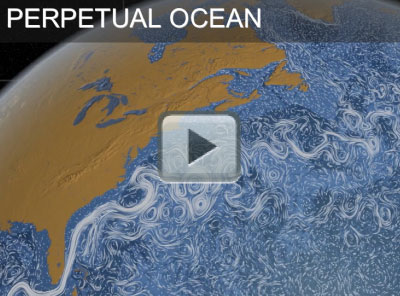
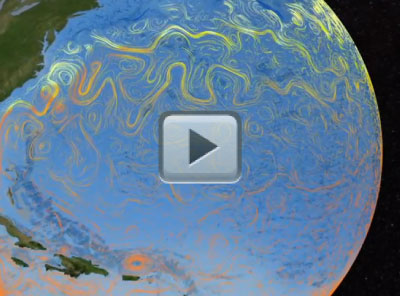
Changes in Global Sea Surface Salinity | Aquarius Sea Surface Salinity Tour 2012 (Spanish Language) | Aquarius Sea Surface Salinity Tour 2012 (English Language) | Perpetual Ocean | |||
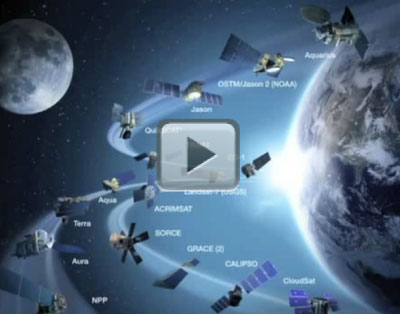
Global View of Sea Surface Salinity From September to December 2011 | Temperature and Surface Currents: Indian & Western Pacific Ocean | Temperature and Surface Currents: Atlantic & Eastern Pacific Ocean | Hyperwall Show: Earth Observing Fleet with Suomi NPP and Aquarius | |||
Thermohaline Circulation Using Improved Flow Field | Aquarius Yields NASA's First Global Map of Ocean Salinity | Large Scale Salinity Distribution Features Measured by Aquarius | Collection of Data Swaths Using the Aquarius Instrument | |||
Power of Sea Salt | Launch of Aquarius! (YouTube) | NASA Aquarius Mission Launch (UStream) | Aquarius/SAC-D Delta II Post-Launch News Conference (UStream) | |||
Aquarius Launch Update: Episode 5 | Aquarius Prepares for Launch: Episode 4 | Aquarius Pre-Launch News Conference and Science Briefing (UStream) | Aquarius Prepares for Launch: Episode 3 | |||
Aquarius Prepares for Launch: Episode 2 | Aquarius Pre-Launch Briefing From NASA HQ (UStream) | Aquarius: Studying the Salt of the Sea | Ocean Circulation | |||
Aquarius Satellite & Data Pre-launch Beauty Shot | Aquarius | Climate | Water Cycle | |||
Aquarius Prepares for Launch: Episode 1 | Climate Change and the Global Ocean | Aquarius Satellite Sensor | Salt of the Earth | |||
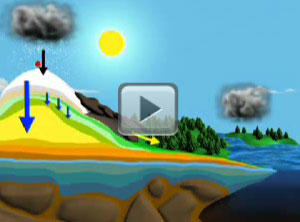
Melting Ice, Rising Seas | Water, Water Everywhere! | The Water Cycle | Sea Surface Salinity | |||
Sea Surface Temperature | Sea Surface Density | Keeping Up With Carbon | The Carbon Cycle | |||
ARGO Float Animation | ||||||
Podcasts (4) | ||||||
Impact of Climate Change on Ocean Chemistry Has Far Reaching Effects | Mission Development Since the First Light Image | Oceans and Climate Change | Mapping the Salt of the Sea | |||

