Gallery
Aquarius Sea Surface Salinity Tour 2012 (Spanish Language) (00:03:17)
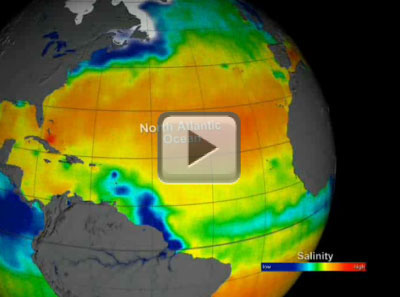
[20-Feb-13] The Aquarius spacecraft is designed to measure global sea surface salinity. It is important to understand salinity, the amount of dissolved salts in water, because it will lead us to better understanding of the water cycle and can lead to improved climate models. Aquarius is a collaboration between NASA and the Space Agency of Argentina.This visualization celebrates over a year of successful Aquarius observations. Sea surface salinity is shown at various locations around the globe highlighting the following:
- The Atlantic Ocean is generally much more salty than the Pacific
- Low salinity waters in the Eastern Equatorial Pacific are transported westward
- High influxes of fresh water from the Amazon River basin can be clearly seen low salinity waters are transported by the Labrador current to the south
- High influxes of fresh water from the Ganges River basin can be seen keeping the Eastern Indian Ocean lower salinity than the Western Indian Ocean
Original Movie: https://svs.gsfc.nasa.gov/vis/a000000/a004000/a004045/index.html