Lagrangian Float Data Visualization

Professor
University of North Carolina
University of North Carolina
Dr. Bingham received his Ph.D. from the University of California, San Diego in Oceanography. His research interests include global distributions of sea surface salinity and large scale regional physical oceanography in the Kuroshio, the western North and Equatorial Pacific, and Onslow Bay, North Carolina.
Webinar Clip
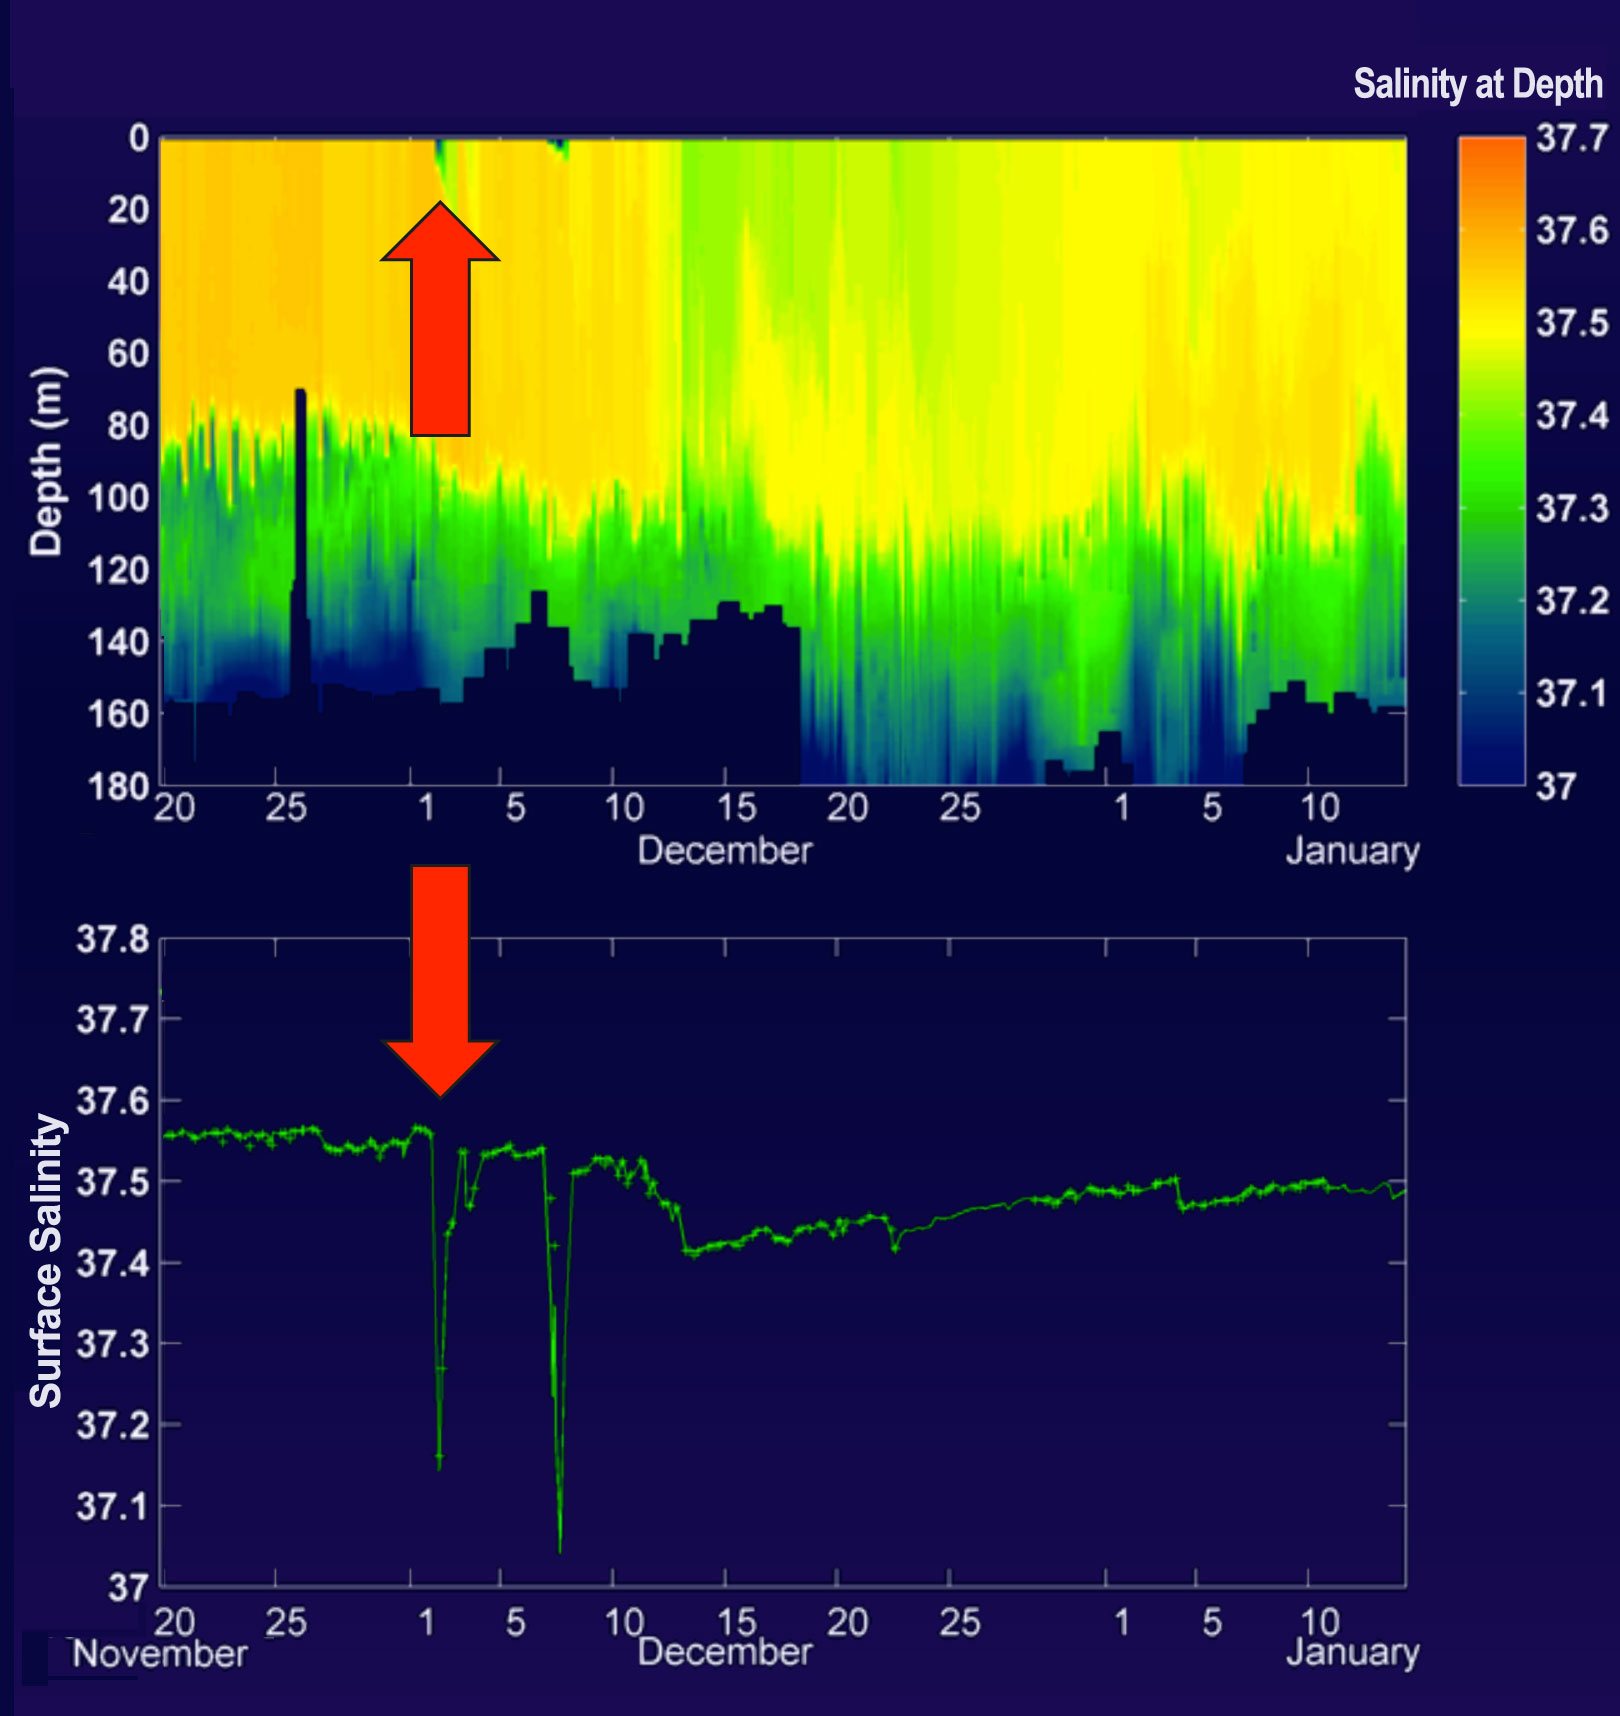
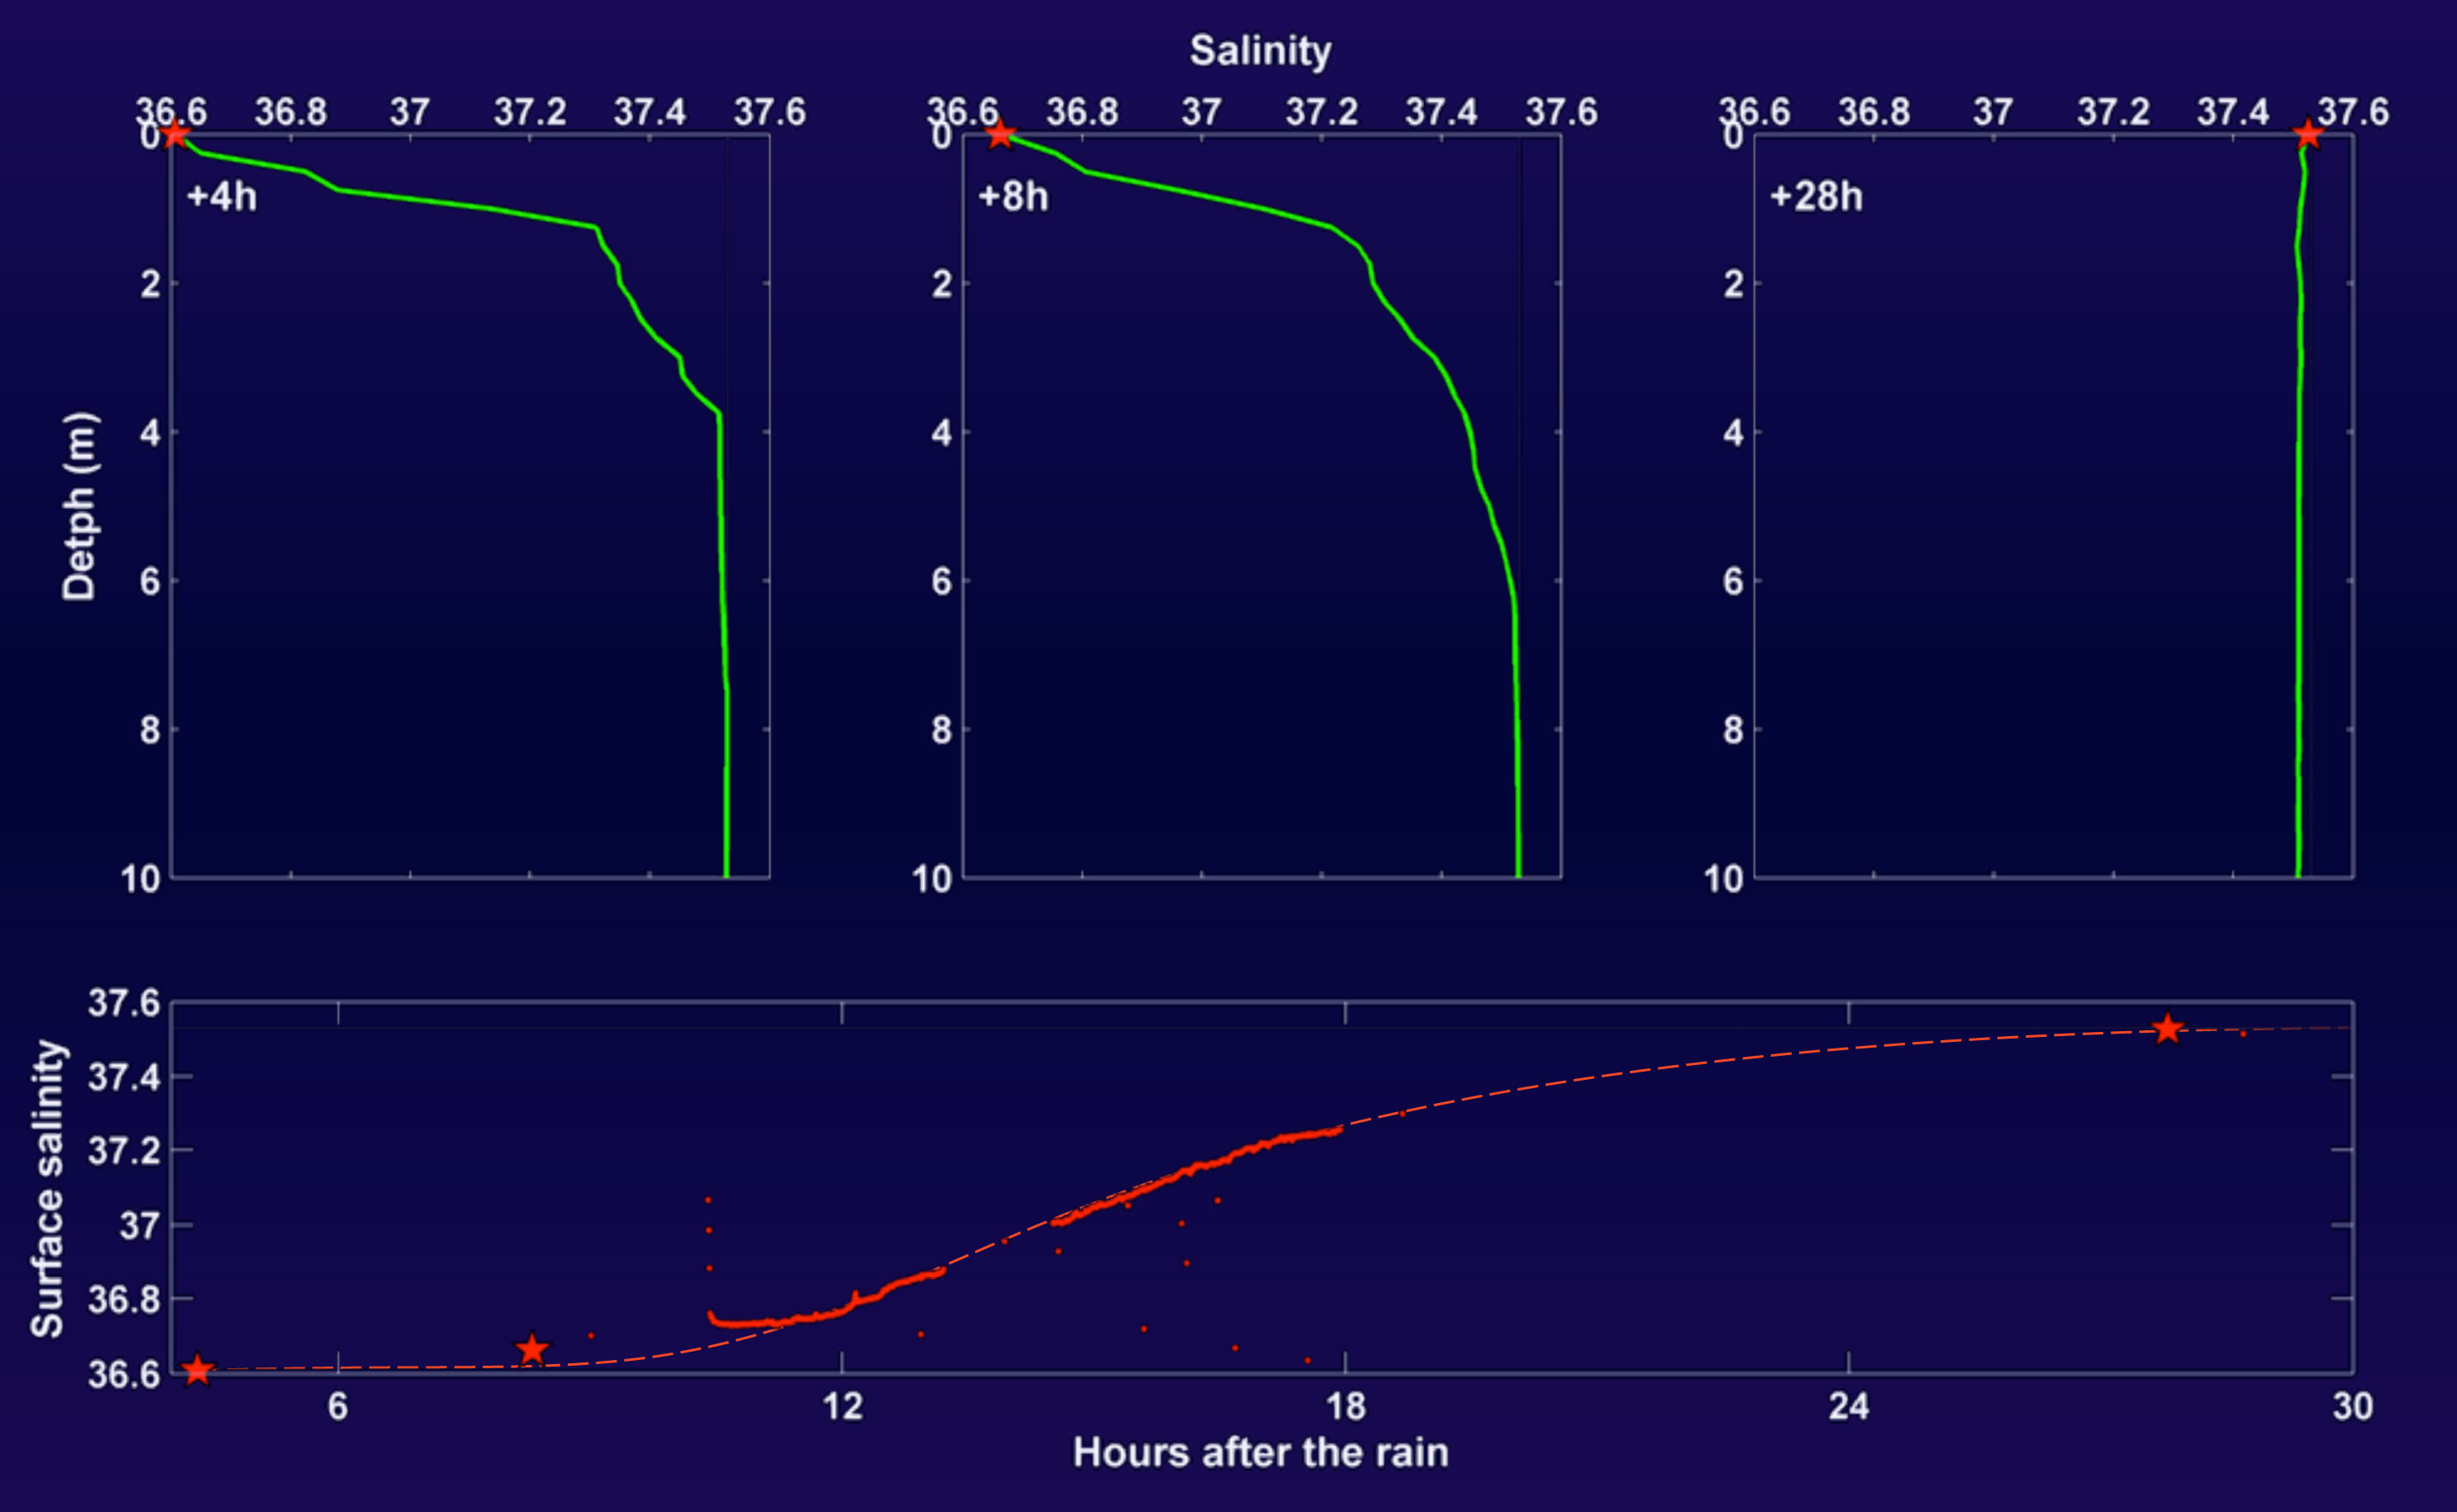
There are a variety of instruments used to collect data at sea but making sense of that data and what they are telling us is often an elaborate and complex task. Here, Dr. Bingham explains what the data generated from a Lagrangian Float look like and what it means in terms of ocean surface salinity. Full webinar: Follow that Salt! Results and the Future of Salinity Exploration
Click here for a transcript of this clip (PDF, 37.2 KB). |
Resources
Applicable Science Standards
 Analyzing and Interpreting Data. Scientific investigations produce data that must be analyzed in order to derive meaning. Because data patterns and trends are not always obvious, scientists use a range of tools - including tabulation, graphical interpretation, visualization, and statistical analysis - to identify the significant features and patterns in the data. Scientists identify sources of error in the investigations and calculate the degree of certainty in the results. Modern technology makes the collection of large data sets much easier, providing secondary sources for analysis.
 Using Mathematics and Computational Thinking. In both science and engineering, mathematics and computation are fundamental tools for representing physical variables and their relationships. They are used for a range of tasks such as constructing simulations; solving equations exactly or approximately; and recognizing, expressing, and applying quantitative relationships.
 Constructing Explanations and Designing Solutions. The goal of science is the construction of theories that provide explanatory accounts of the world. A theory becomes accepted when it has multiple lines of empirical evidence and greater explanatory power of phenomena than previous theories.