Education: Gallery
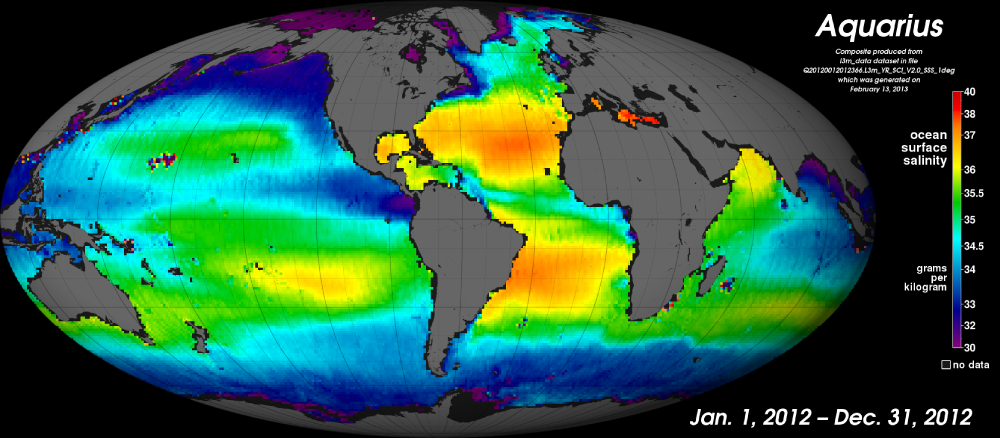
Long Term Composite Image: 01-Jan-12 to 31-Dec-12
[28-Jan-14] Global ocean surface salinity composite map produced using Aquarius V2.0 data averaged over 2012. Credit: Norman Kuring, NASA GSFC.View: Click on the image to enlarge. Click on the Escape key or anywhere outside the shadowbox to close.
Download: To download a copy, right click on the image and select Save Image As (on a Mac keyboard, click the touchpad while holding down the Control key). To download the highest resolution in our database, first click on the image to enlarge and then save that version.