Gallery: Aquarius Data
Scientists involved with the Aquarius/SAC-D mission have a wealth of data at their fingertips, owing in large part to the immense amount of
instrumentation aboard the satellite. The main focus of the mission was to detect changes in
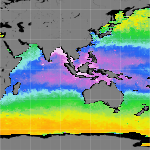
ocean surface salinity on a global scale, as shown on monthly images produced by NASA's Goddard Space Flight Center. Scientists are also able to
measure salinity variance and brightness temperature at high latitudes, which are depicted in weekly maps. (View our
FAQs page for an explanation of brightness temperature.)
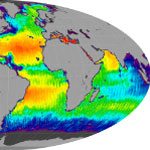 These maps show mission composite, monthly, seasonal, and annual data and are produced by Norman Kuring (NASA Goddard Space Flight Center) and are based on the latest algorithms developed by the Aquarius Calibration/Validation working group. (161 images)
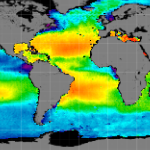 These maps show global sea surface salinity averaged by month and season.They are produced using software written by Joel Gales, John Wilding, and others at NASA Goddard Space Flight Center and are based on the latest algorithms developed by the Aquarius Calibration/Validation working group. (16 images)
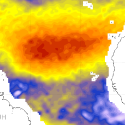
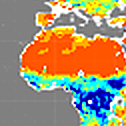
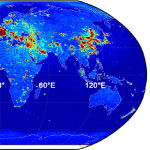 Radio Frequency Interference (RFI) can mask the salinity signal measured by the microwave radiometers.These monthly images, produced by Paolo de Matthaeis (NASA Goddard Space Flight Center), show global monthly RFI at 1.413 GHz, the frequency of the three radiometers on board Aquarius. (45 images)
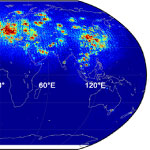 RFI can mask the salinity signal measured by the scatterometer.These monthly images, produced by Paolo de Matthaeis (NASA Goddard Space Flight Center), show global monthly RFI at 1.26 GHz, the frequency of the scatterometer on board Aquarius. (45 images)
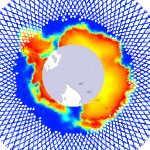
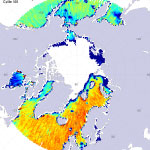 These weekly maps, produced by Ludovic Brucker (NASA Goddard Space Flight Center and Universities Space Research Association) and Emmanuel Dinnat (NASA Goddard Space Flight Center and Chapman University), are made using Aquarius sea surface salinity retrievals and show sea surface salinity at latitudes higher than 50°. (392 images)
 These weekly maps, produced by Ludovic Brucker (NASA Goddard Space Flight Center and Universities Space Research Association) and Emmanuel Dinnat (NASA Goddard Space Flight Center and Chapman University), show the Aquarius (L-Band, about 1.4 GHz) brightness temperature measurements recorded at vertical polarization at latitudes higher than 50°. (392 images)
 These weekly gridded maps, produced by Oleg Melnichenko (International Pacific Research Center), are based on the optimum interpolation (OI) analysis of Aquarius sea surface salinity data for the North Atlantic Ocean. (195 images)
 These monthly maps, produced by NASA Goddard Space Flight Center's Aquarius Data Processing System, are derived from Aquarius sea surface salinity and ancillary sea surface temperature using TEOS-10 equation of state. (45 images)
 These monthly maps, produced by NASA Goddard Space Flight Center's Aquarius Data Processing System, are derived from L-band horizontally polarized brightness temperature observations of Aquarius. (47 images)