Gallery: Sea Surface Salinity at High Latitudes
These weekly gridded maps are made using the Aquarius sea surface salinity retrievals. They were obtained with algorithms
developed by the Calibration/Validation working group, and applied to the microwave (L-band, about 1.4 GHz) brightness
temperature measurements along the spacecraft swath. These maps show sea surface salinity expressed in practical salinity unit
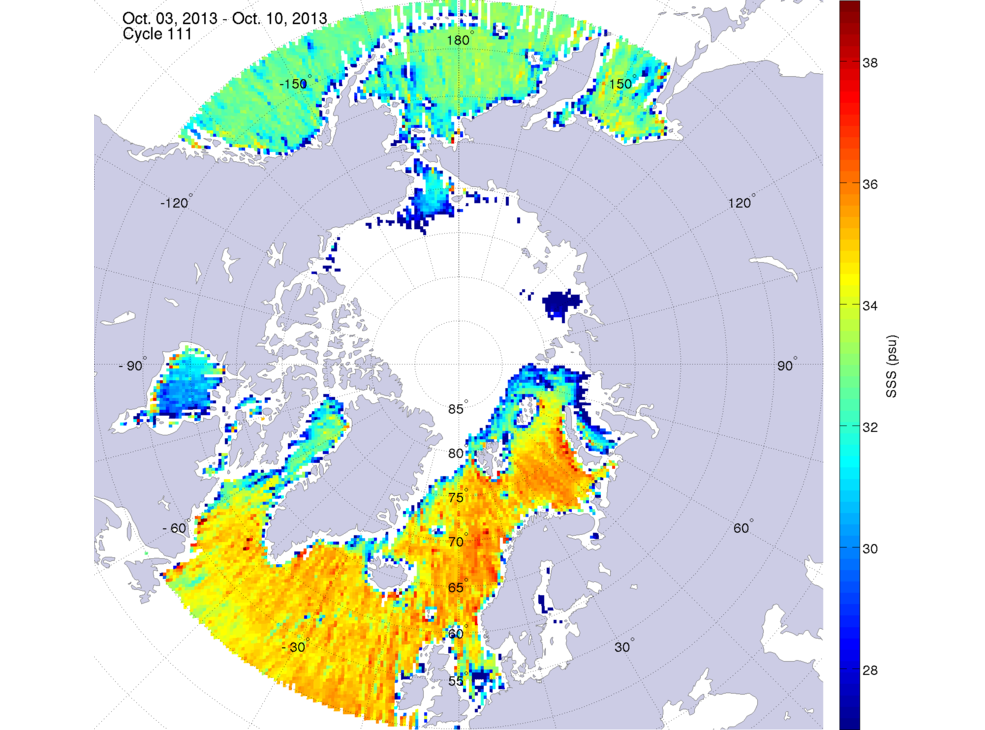
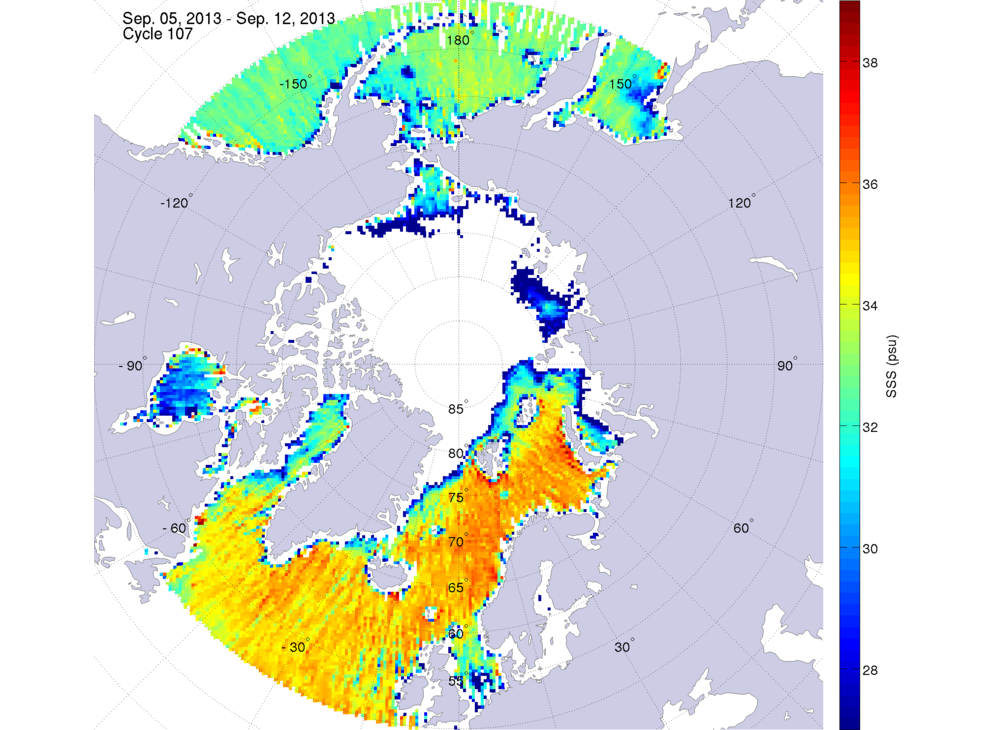
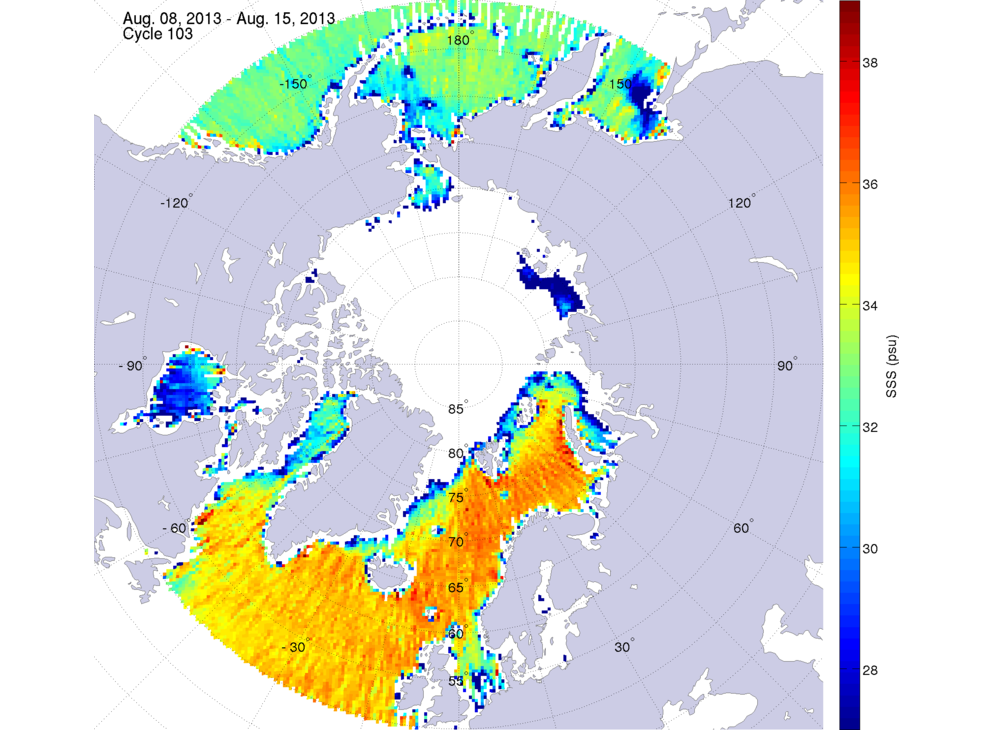
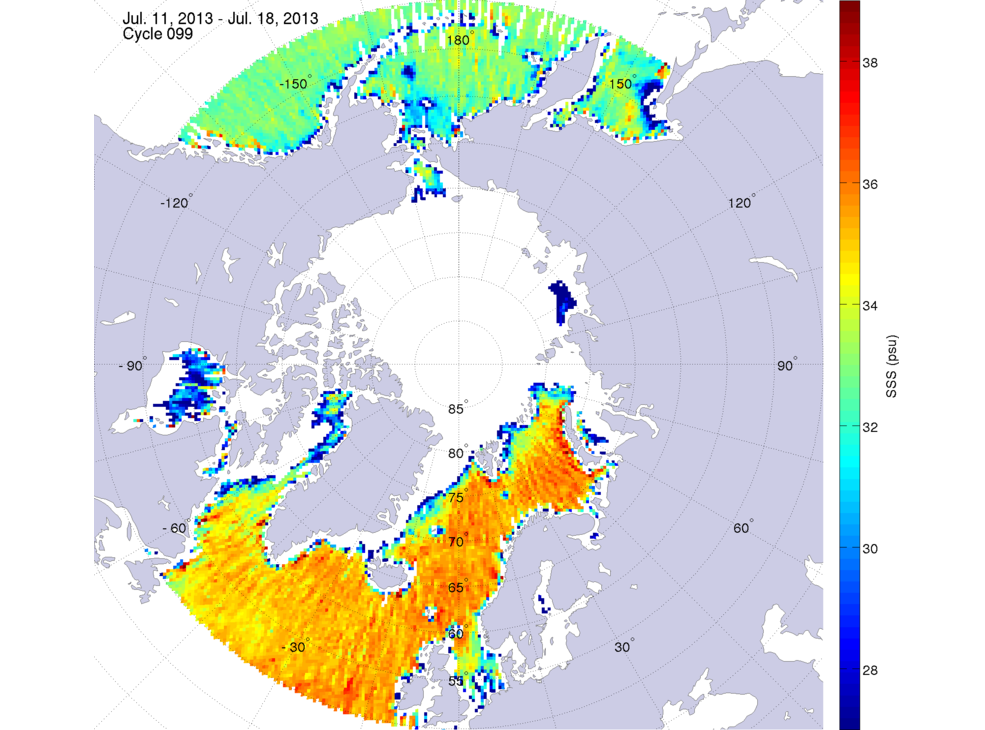
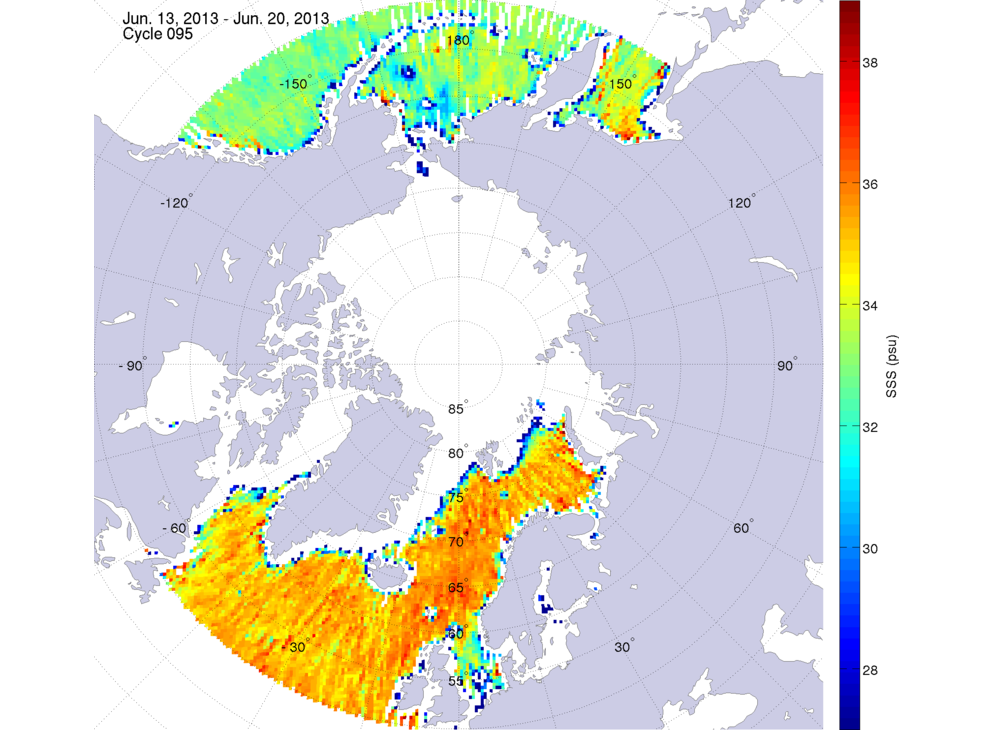
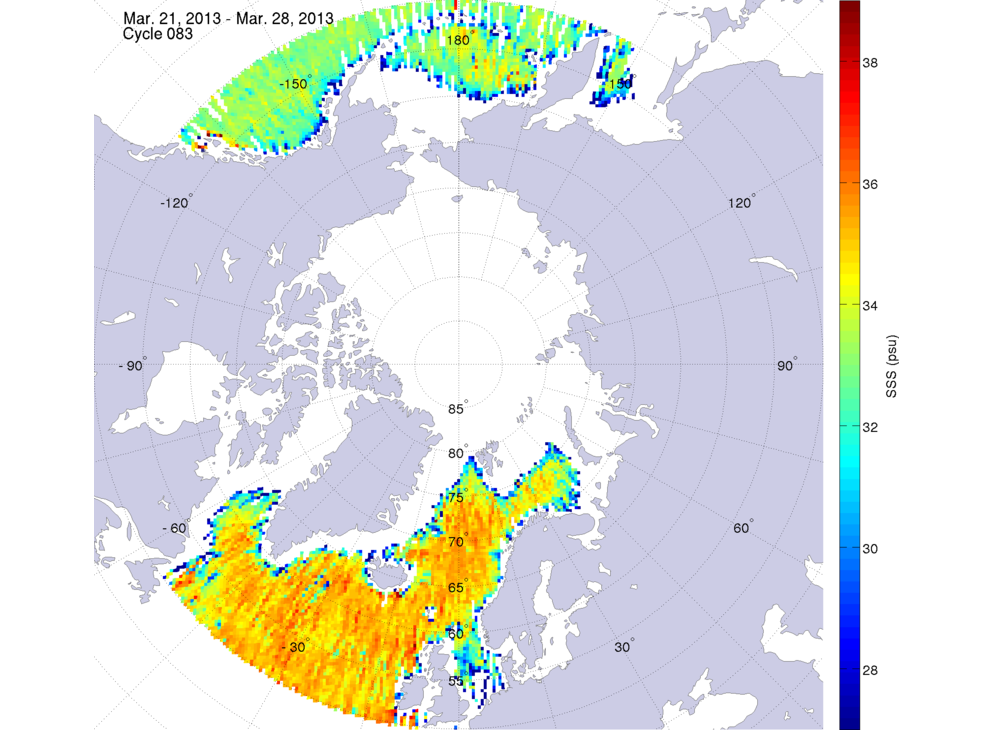
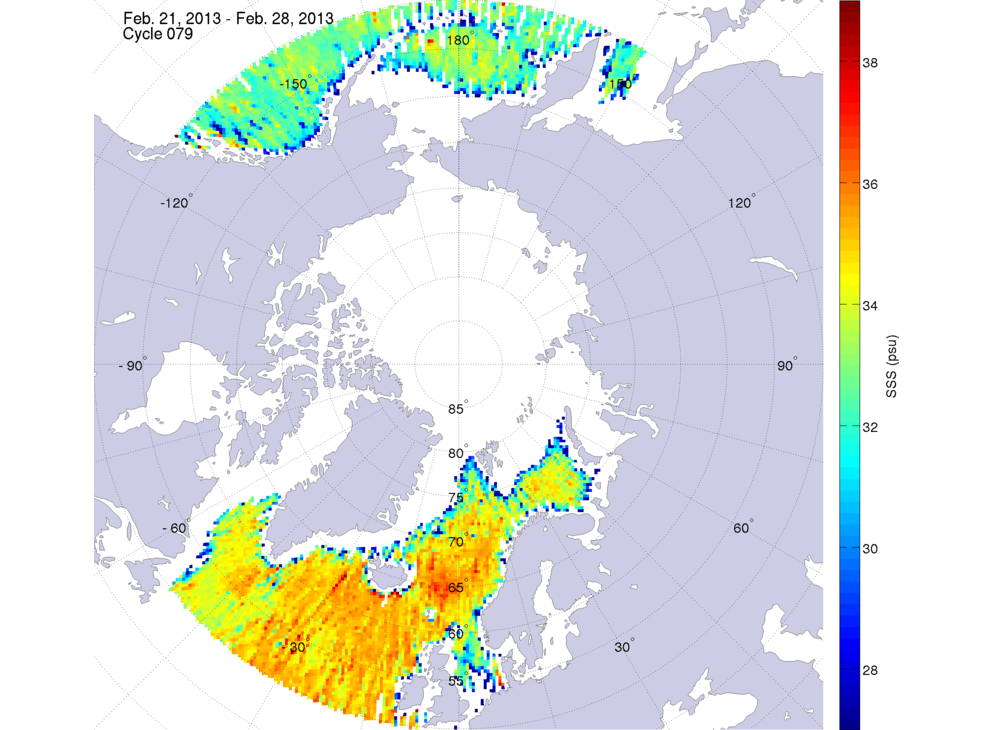
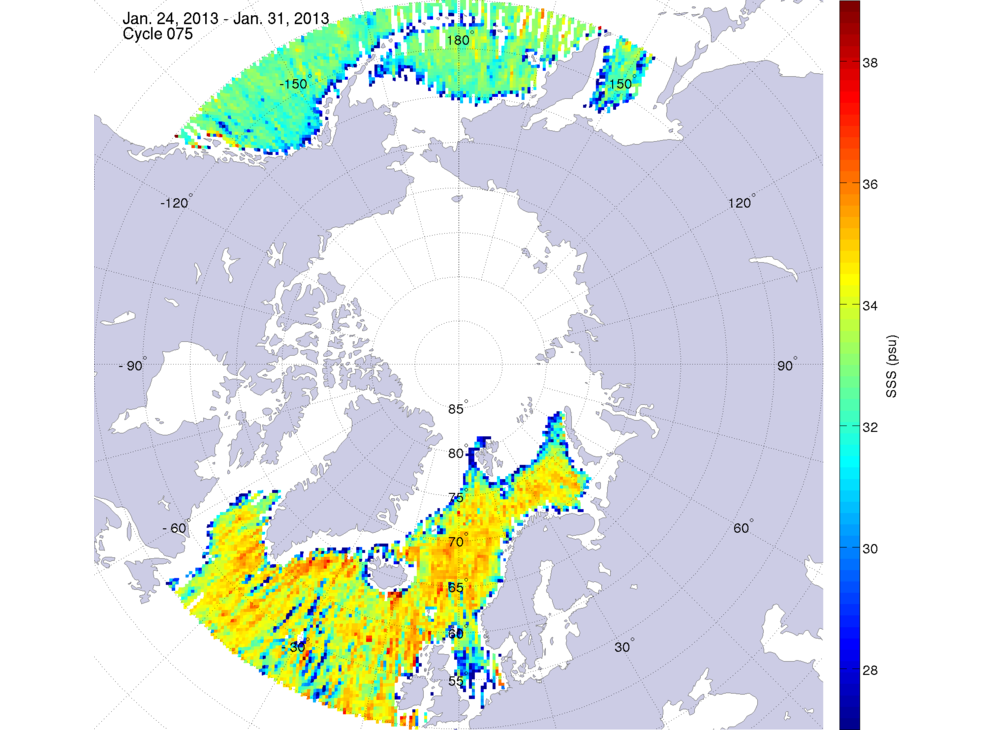
(psu) in the Northern and Southern Hemispheres at latitudes higher than 50°. Blue colors represent lower salinity, whereas
red colors represent higher salinity. The date shown on the images (below) is the first day of that weekly measurement.
Salinity can only be retrieved from space when the ocean is not covered by sea ice. Sea ice is frozen ocean water. It forms, grows, and melts according to the seasons, but some sea ice remains year round in certain regions of both the Arctic and Antarctic. When a significant fraction of sea ice is present in the Aquarius measurements, salinity cannot be retrieved accurately. These areas were masked on the maps. Other areas without data correspond to either a lack of observations due to orbit geometry and spacecraft maneuvers, or are coastal regions where salinity is inaccurate.
The data presented are a weekly gridded average of the swath data distributed by NASA's Physical Oceanography Distributed Active Archive Center (PO.DAAC) and provided by Ludovic Brucker (1,2) and Emmanuel Dinnat (1,3). Aquarius Level-3 weekly polar-gridded data sets can be downloaded from the National Snow and Ice Data Center (NSIDC).
These maps also show the significant difference between the saltier Atlantic Ocean and the fresher Pacific Ocean. Ocean surface salinity in polar regions varies seasonally as ice freezes (i.e., leaving saltier water in the ocean) and melts (i.e., adding fresh water to the ocean).
Brucker, L., Dinnat, E.P., and Koenig, L.S. (2014b). Weekly Gridded Aquarius L-band Radiometer/Scatterometer Observations and Salinity Retrievals Over the Polar Regions - Part 2: Initial Product Analysis, The Cryosphere, 8, 915-930, doi:10.5194/tc-8-915-2014.
Brucker, L., Dinnat, E.P., Picard, G., and Champollion, N. (2014c). Effect of Snow Surface Metamorphism on Aquarius L-Band Radiometer Observations at Dome C, Antarctica, IEEE Transactions on Geoscience and Remote Sensing, 52 (11), 1-10, doi: 10.1109/TGRS.2014.2312102.
Salinity can only be retrieved from space when the ocean is not covered by sea ice. Sea ice is frozen ocean water. It forms, grows, and melts according to the seasons, but some sea ice remains year round in certain regions of both the Arctic and Antarctic. When a significant fraction of sea ice is present in the Aquarius measurements, salinity cannot be retrieved accurately. These areas were masked on the maps. Other areas without data correspond to either a lack of observations due to orbit geometry and spacecraft maneuvers, or are coastal regions where salinity is inaccurate.
The data presented are a weekly gridded average of the swath data distributed by NASA's Physical Oceanography Distributed Active Archive Center (PO.DAAC) and provided by Ludovic Brucker (1,2) and Emmanuel Dinnat (1,3). Aquarius Level-3 weekly polar-gridded data sets can be downloaded from the National Snow and Ice Data Center (NSIDC).
(1) NASA Goddard Space Flight Center, Cryospheric Sciences Lab, Greenbelt MD, USA
(2) Universities Space Research Association, Greenbelt MD, USA
(3) Chapman University, Orange CA, USA
(2) Universities Space Research Association, Greenbelt MD, USA
(3) Chapman University, Orange CA, USA
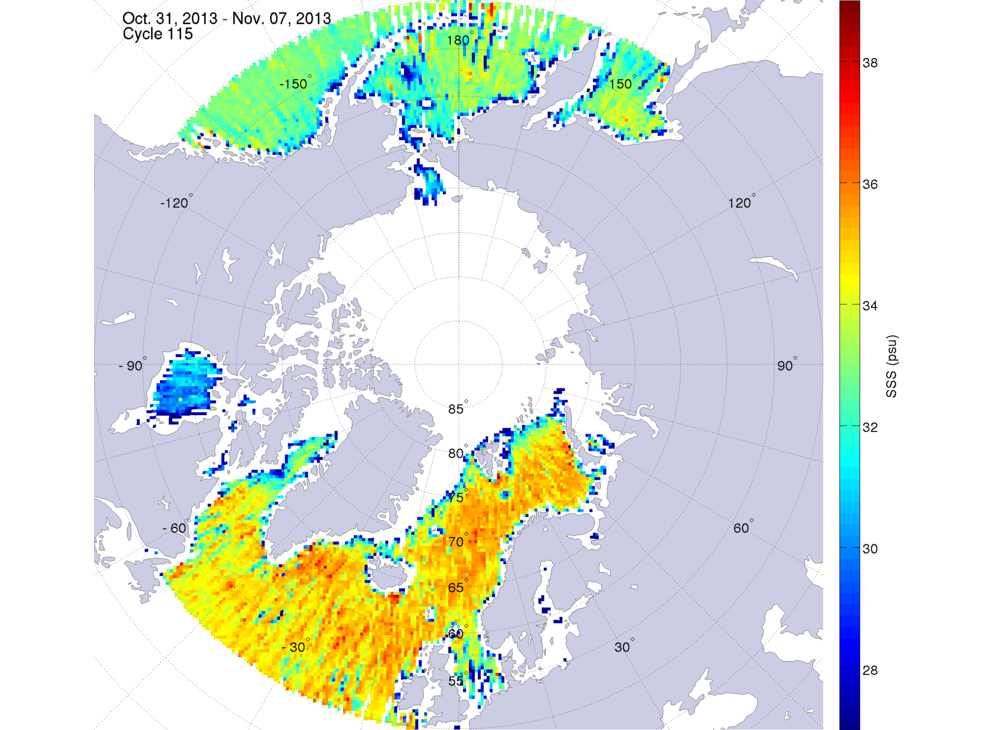
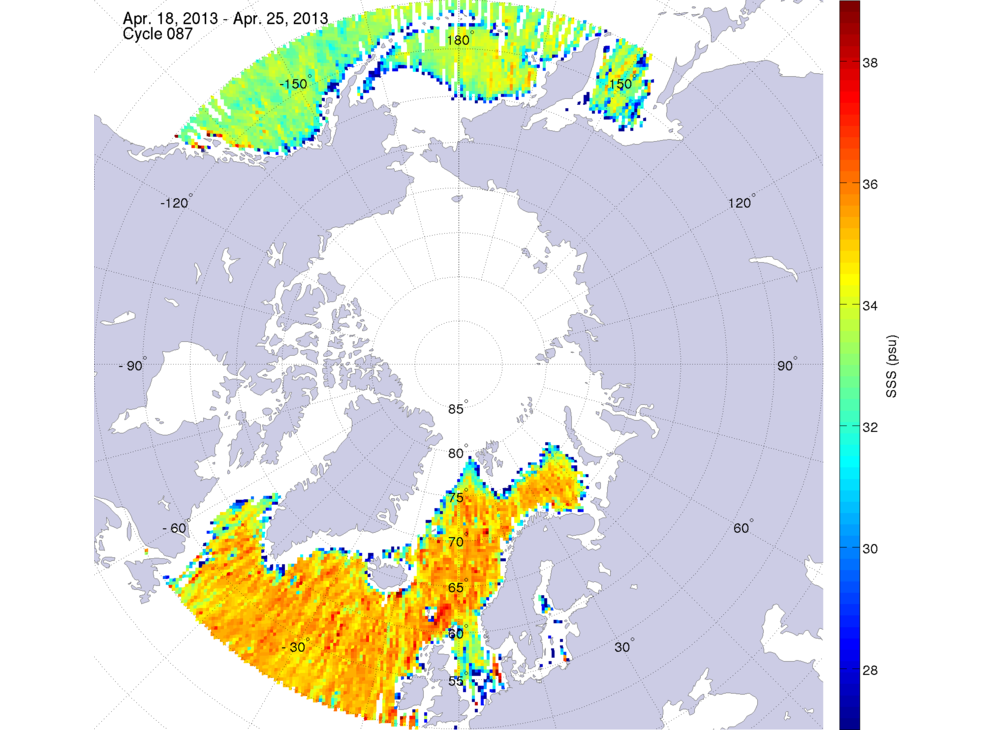
Aquarius Retrieved Sea Surface Salinity in the Northern High-Latitude Ocean
When ocean surface salinity retrievals are possible in the Arctic Ocean, values are smaller than for other regions. One can
also see that blue colors are usually present in the vicinity of the sea ice margin. This may result from sea ice contamination
of the Aquarius measurements, and do not necessarily reflect a low salinity.These maps also show the significant difference between the saltier Atlantic Ocean and the fresher Pacific Ocean. Ocean surface salinity in polar regions varies seasonally as ice freezes (i.e., leaving saltier water in the ocean) and melts (i.e., adding fresh water to the ocean).
2013 Maps: Northern Hemisphere | ||||||
 December 26, 2013 | 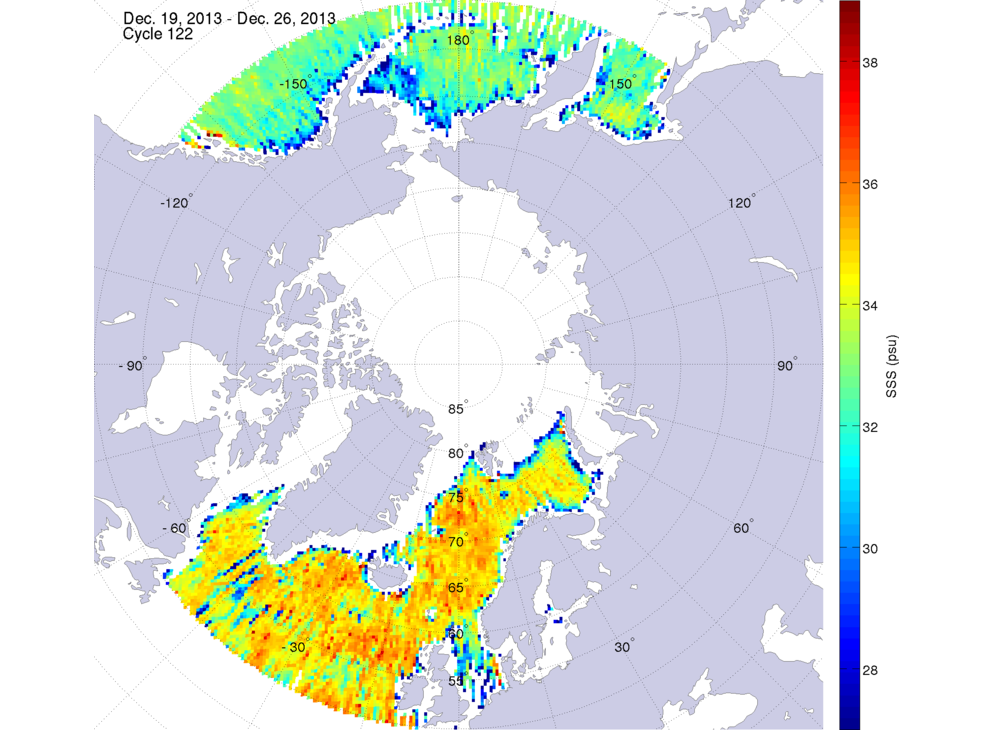 December 19, 2013 | 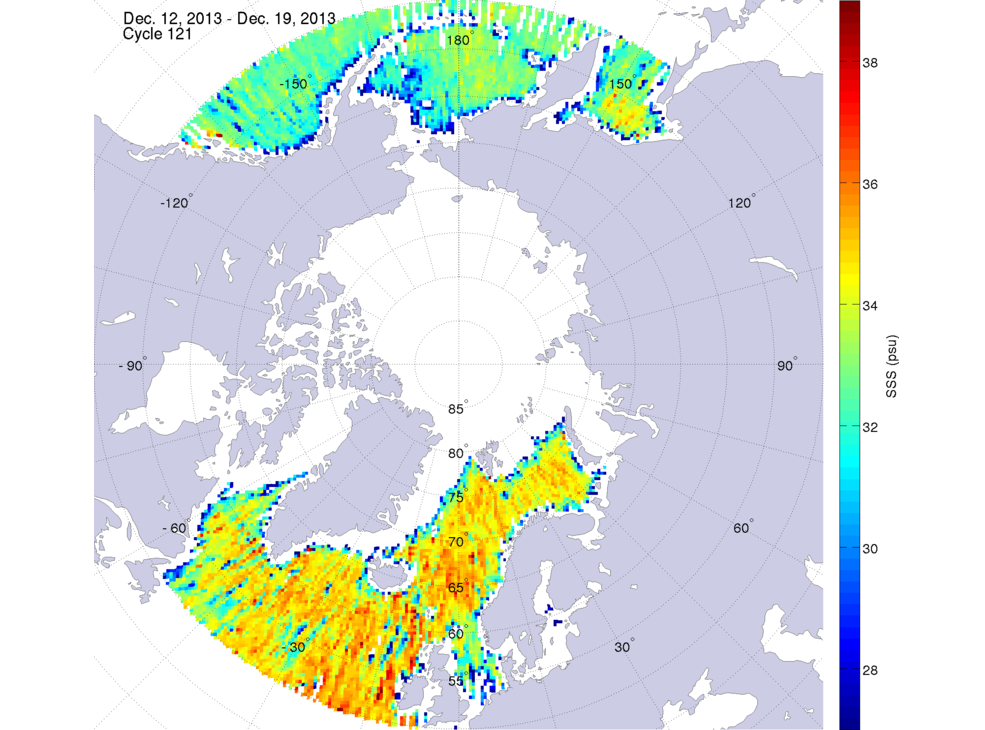 December 12, 2013 | 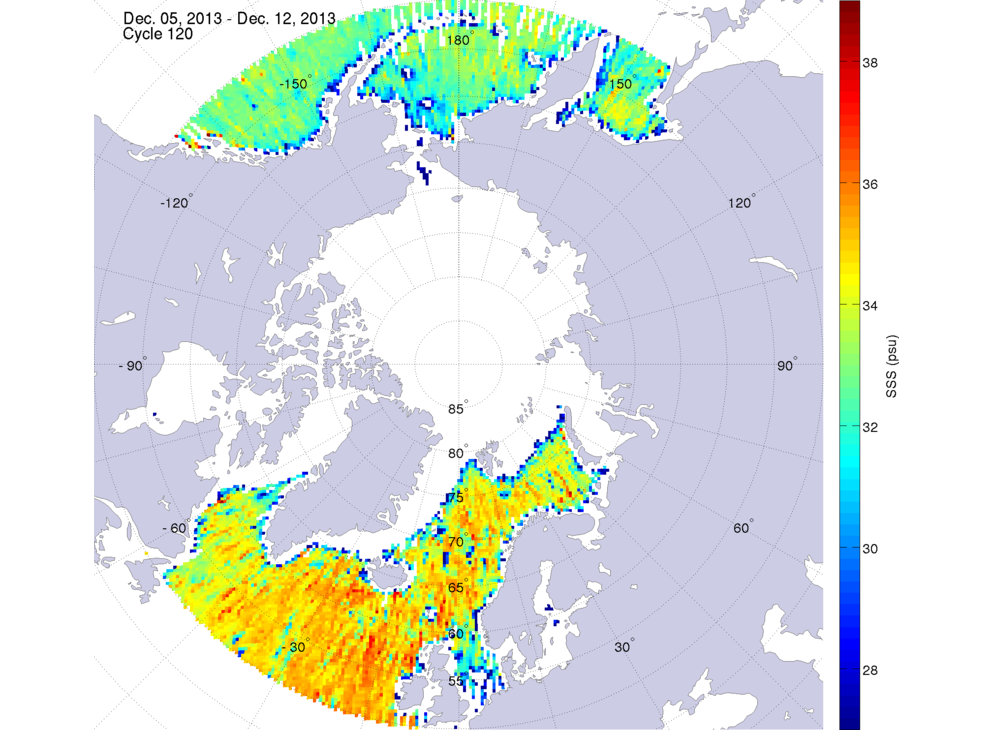 December 5, 2013 | |||
 November 28, 2013 | 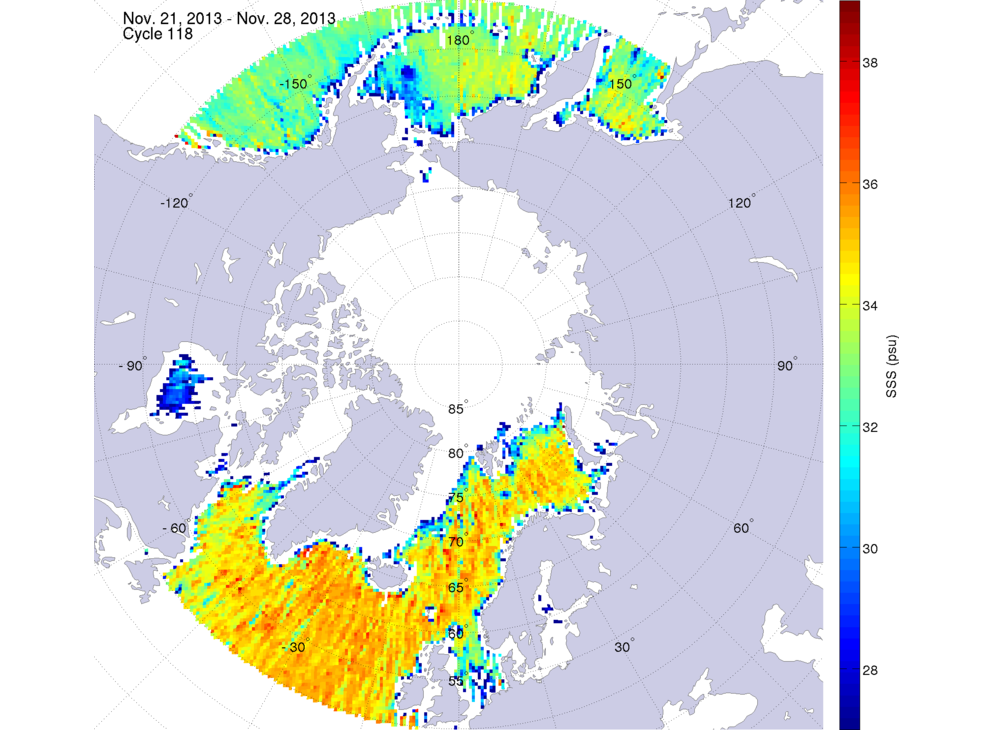 November 21, 2013 | 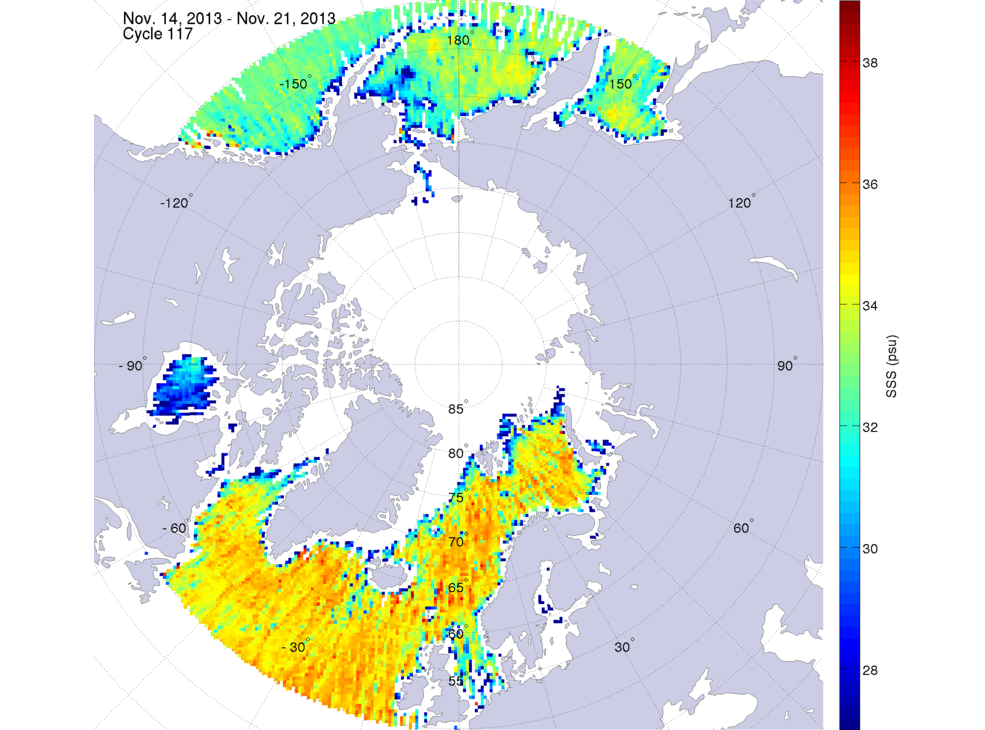 November 14, 2013 | 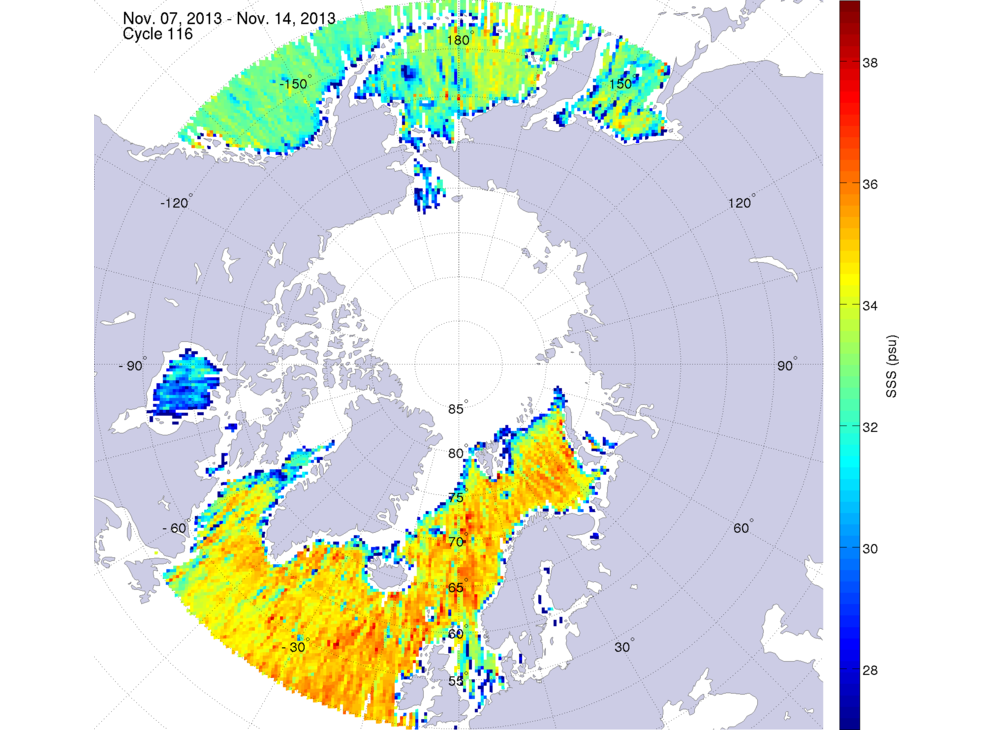 November 7, 2013 | |||
 October 31, 2013 | 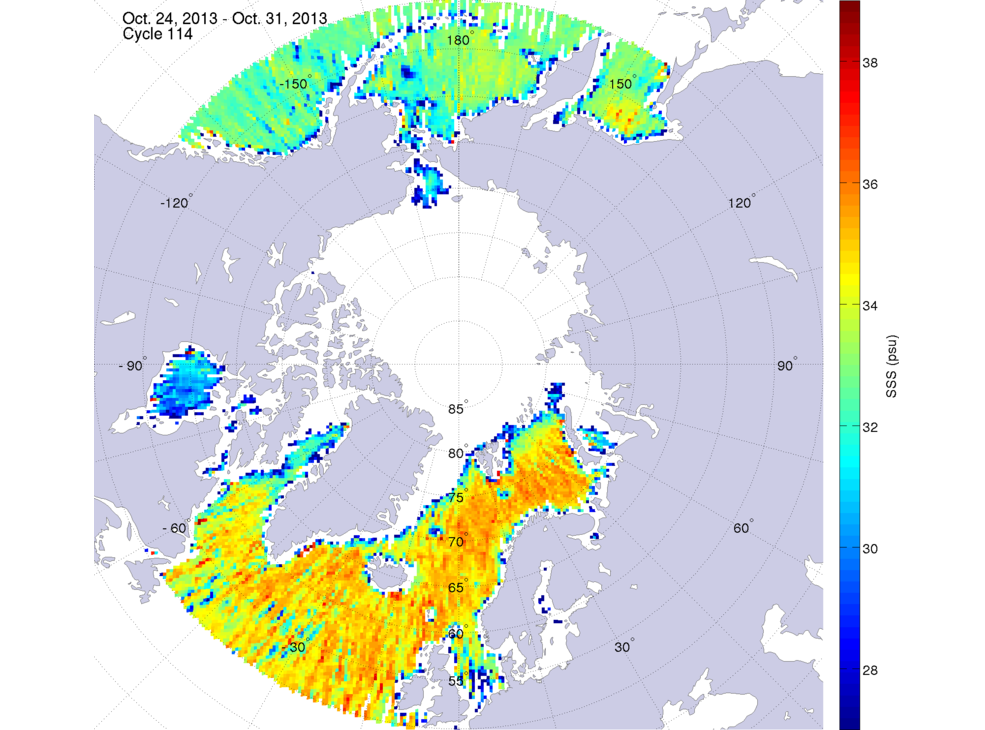 October 24, 2013 | 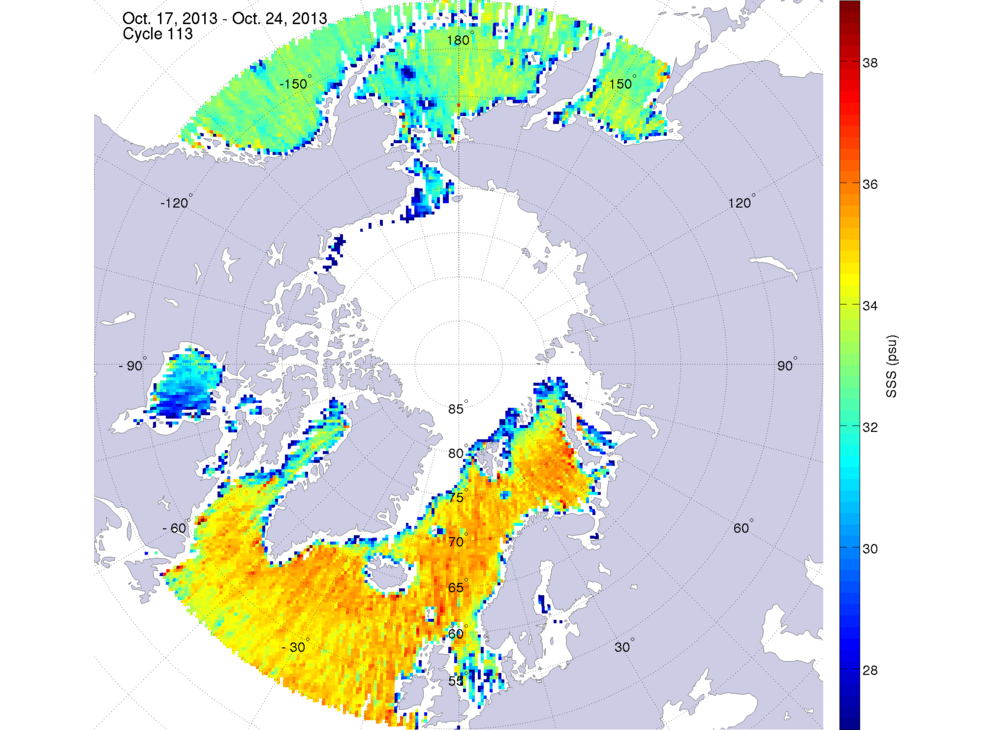 October 17, 2013 | 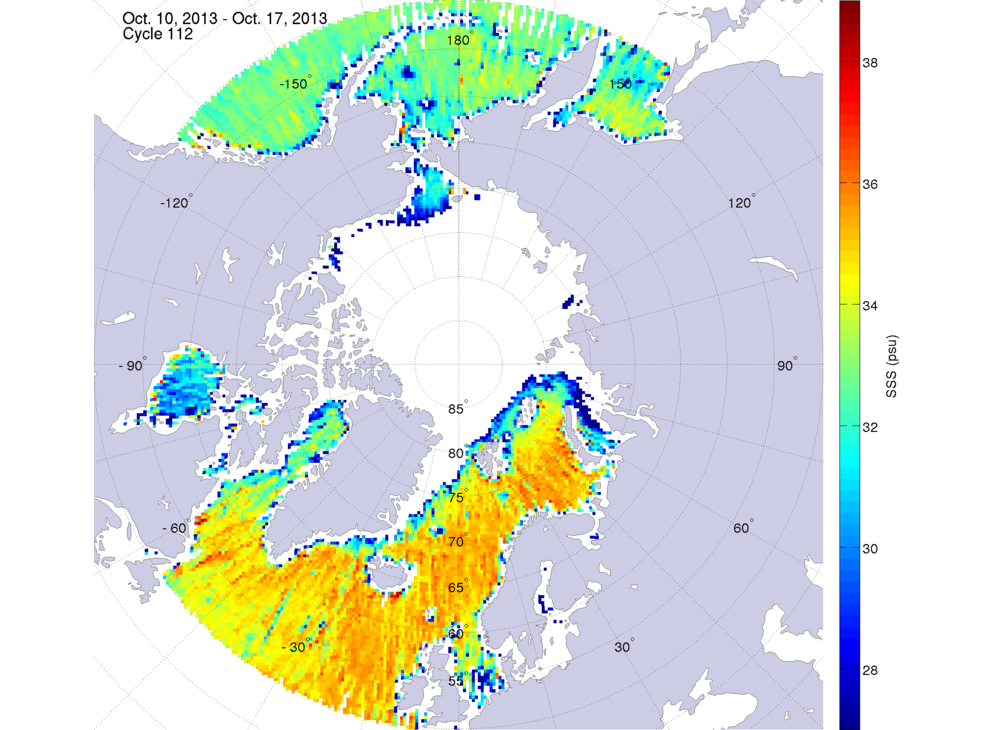 October 10, 2013 | |||
 October 3, 2013 | 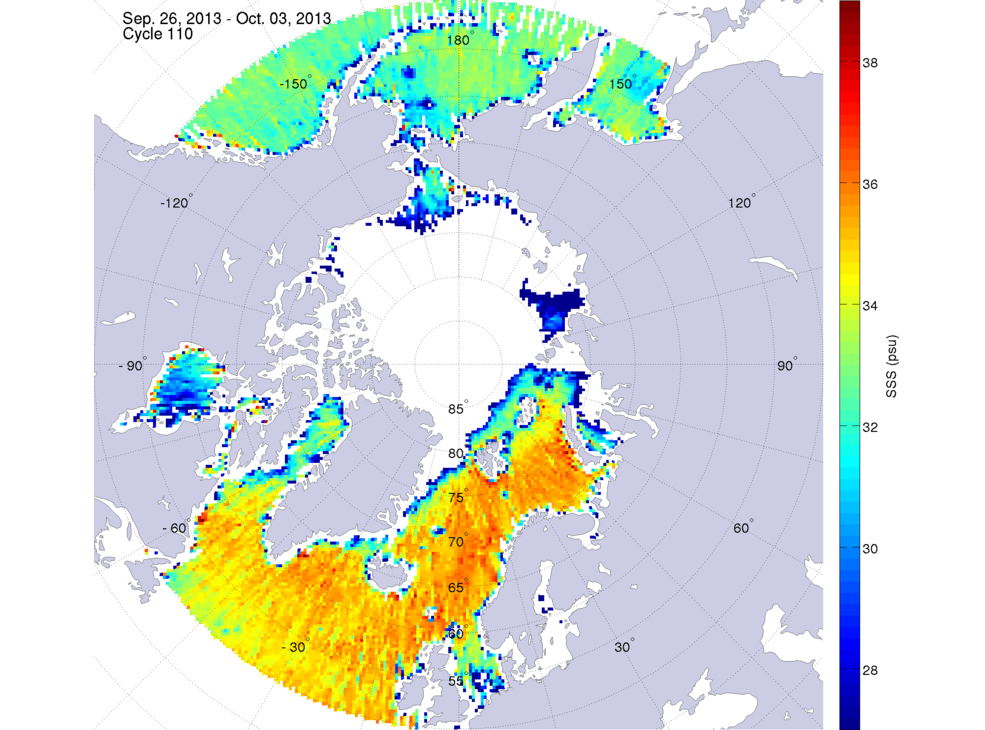 September 26, 2013 | 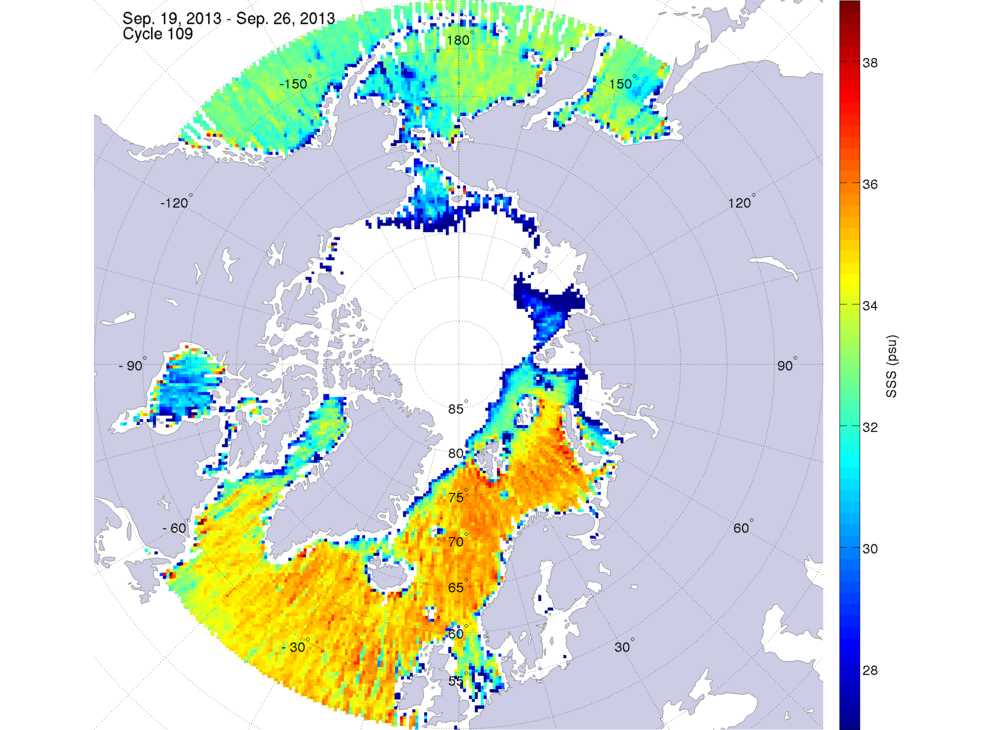 September 19, 2013 | 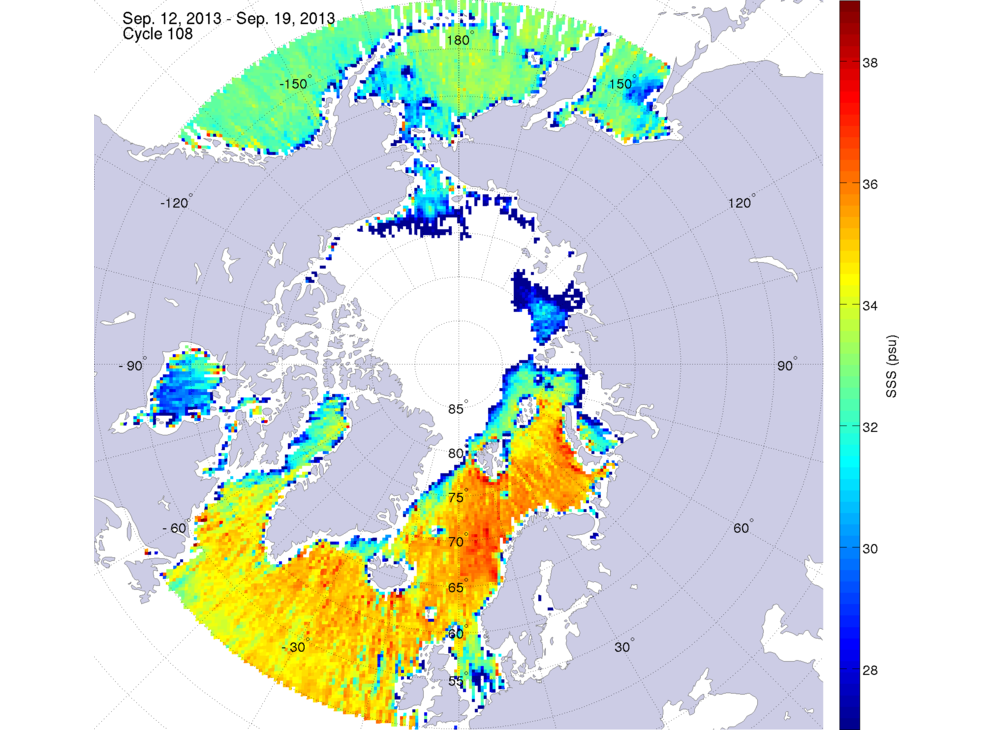 September 12, 2013 | |||
 September 5, 2013 | 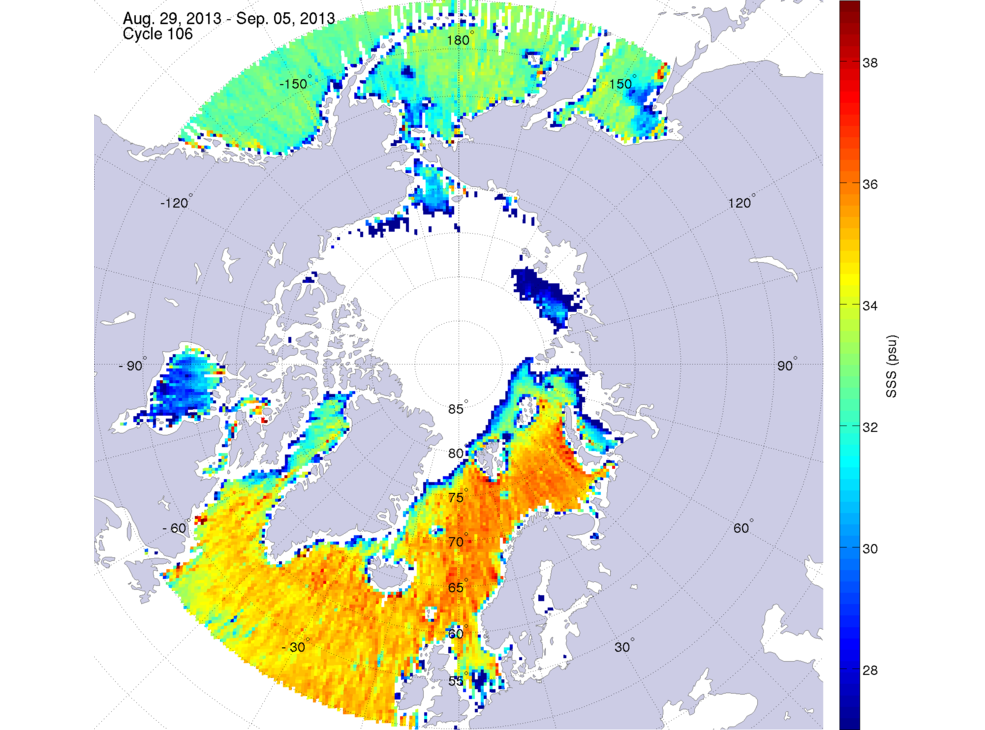 August 29, 2013 | 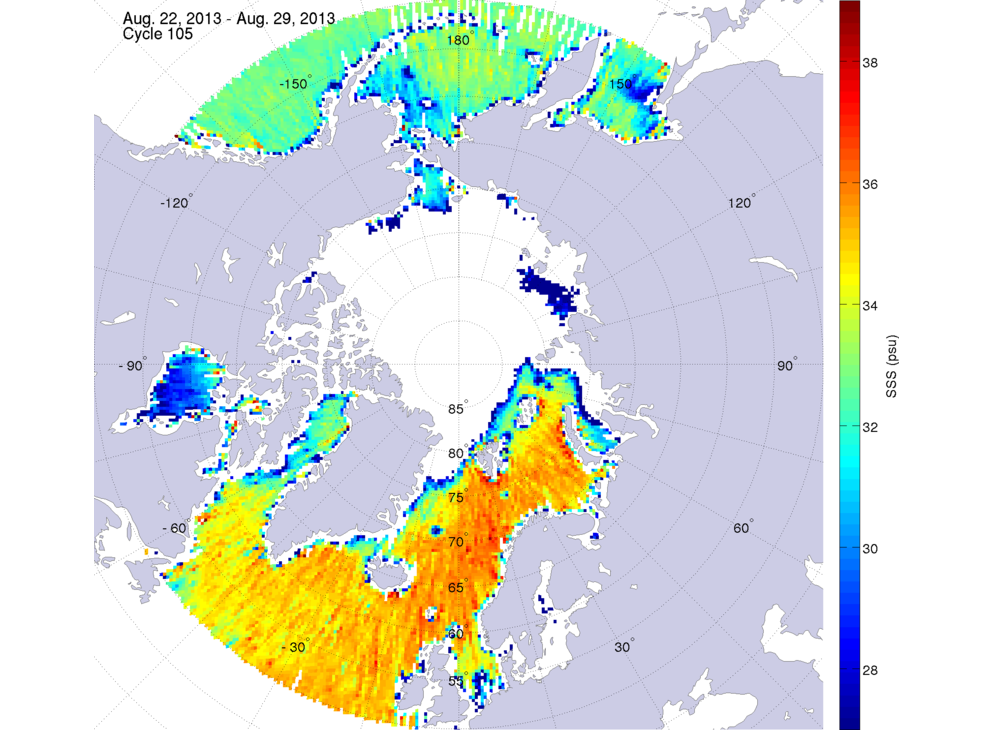 August 22, 2013 | 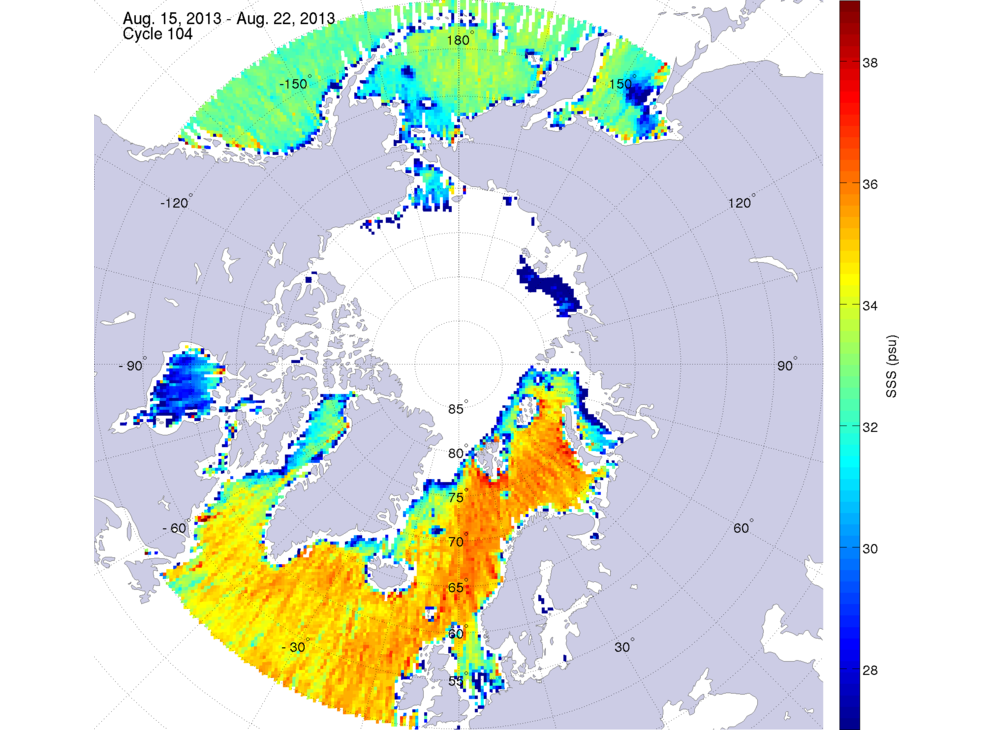 August 15, 2013 | |||
 August 8, 2013 | 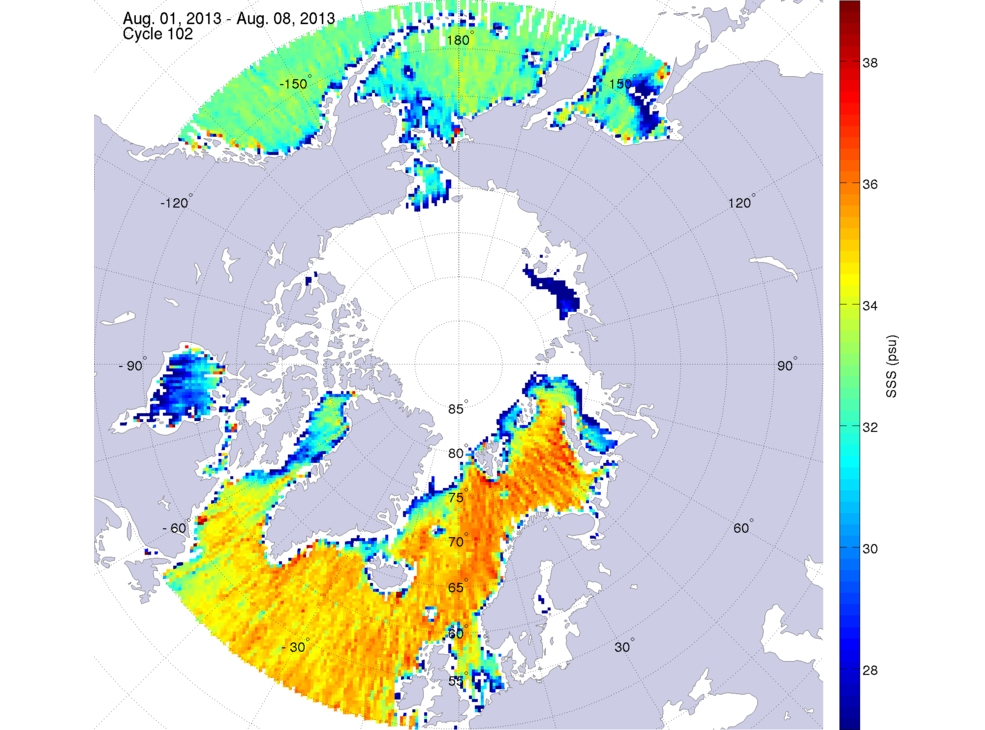 August 1, 2013 | 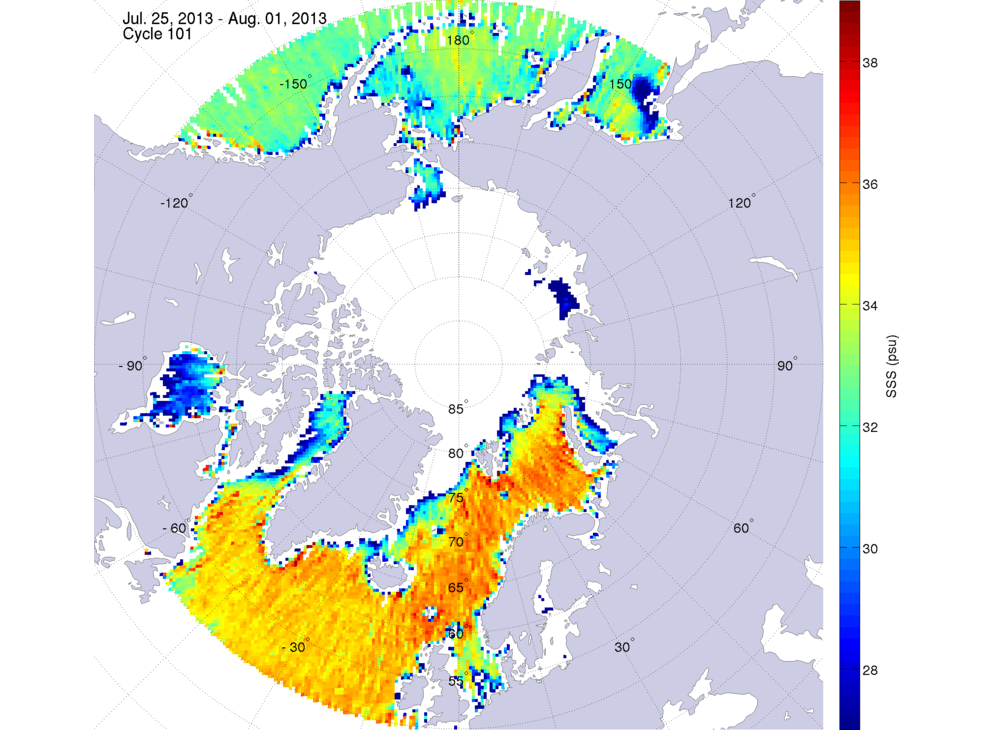 July 25, 2013 | 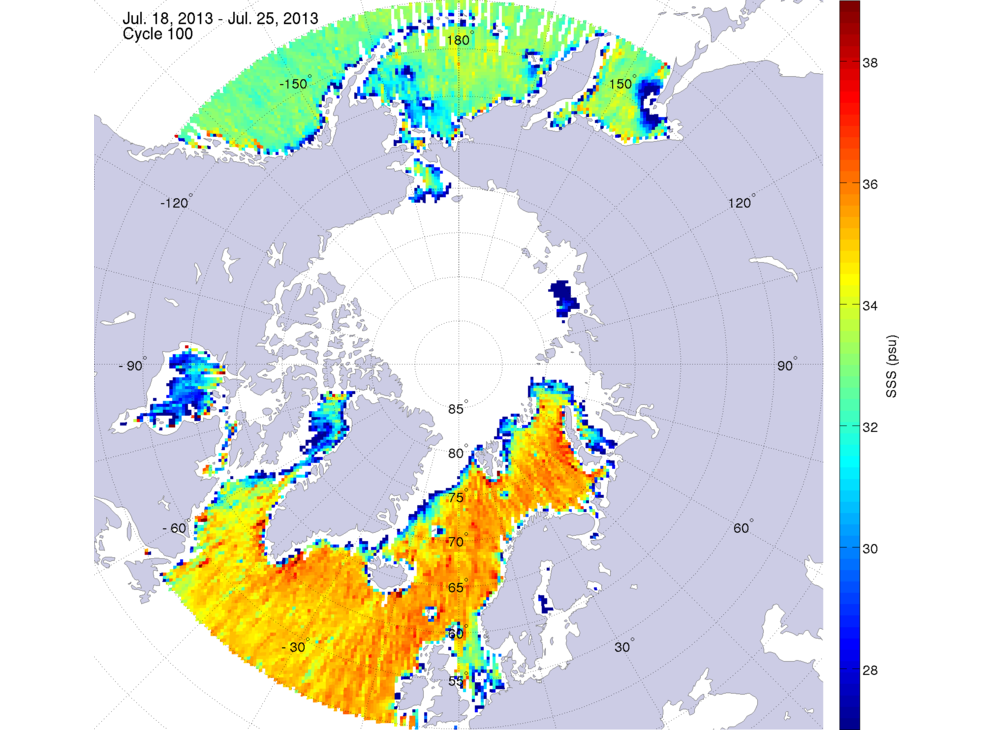 July 18, 2013 | |||
 July 11, 2013 | 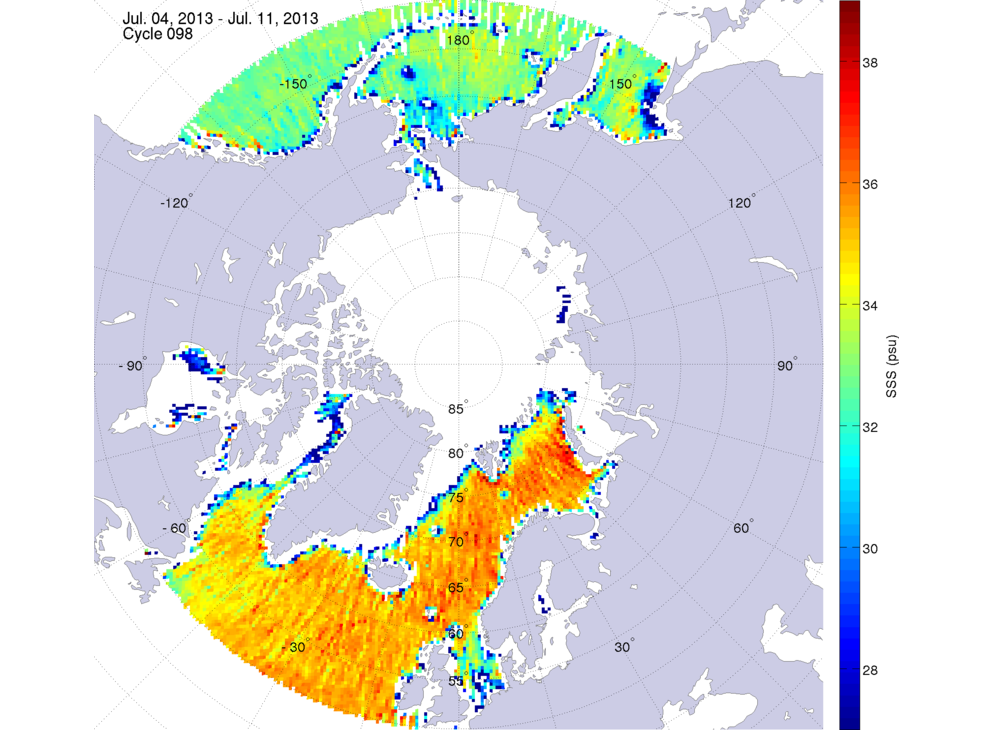 July 4, 2013 | 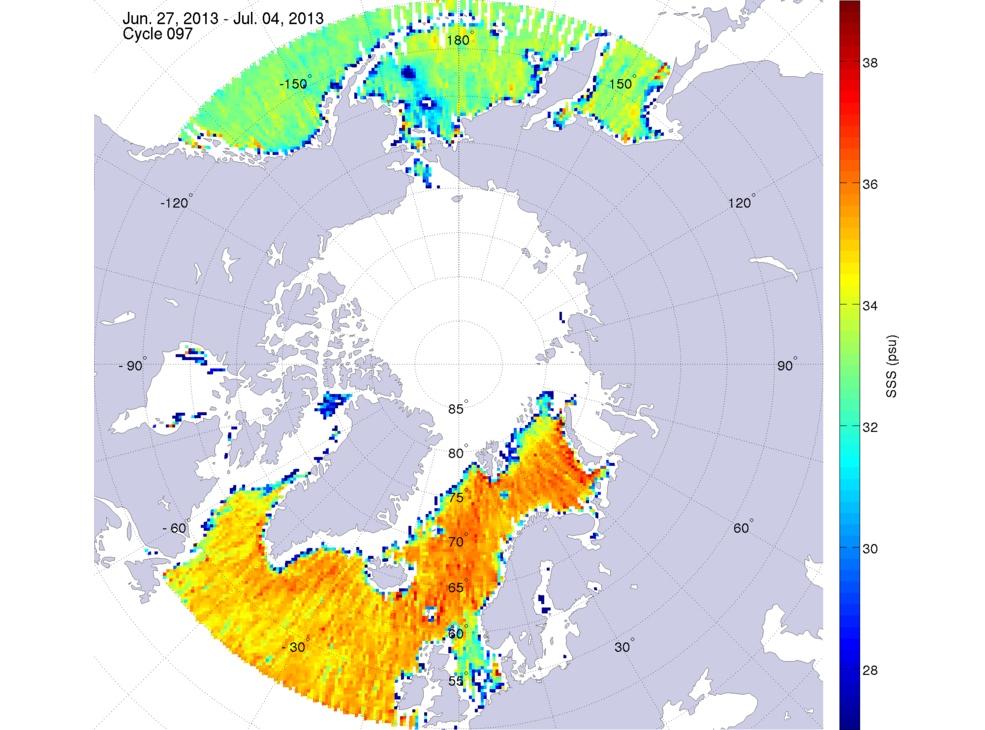 June 27, 2013 | 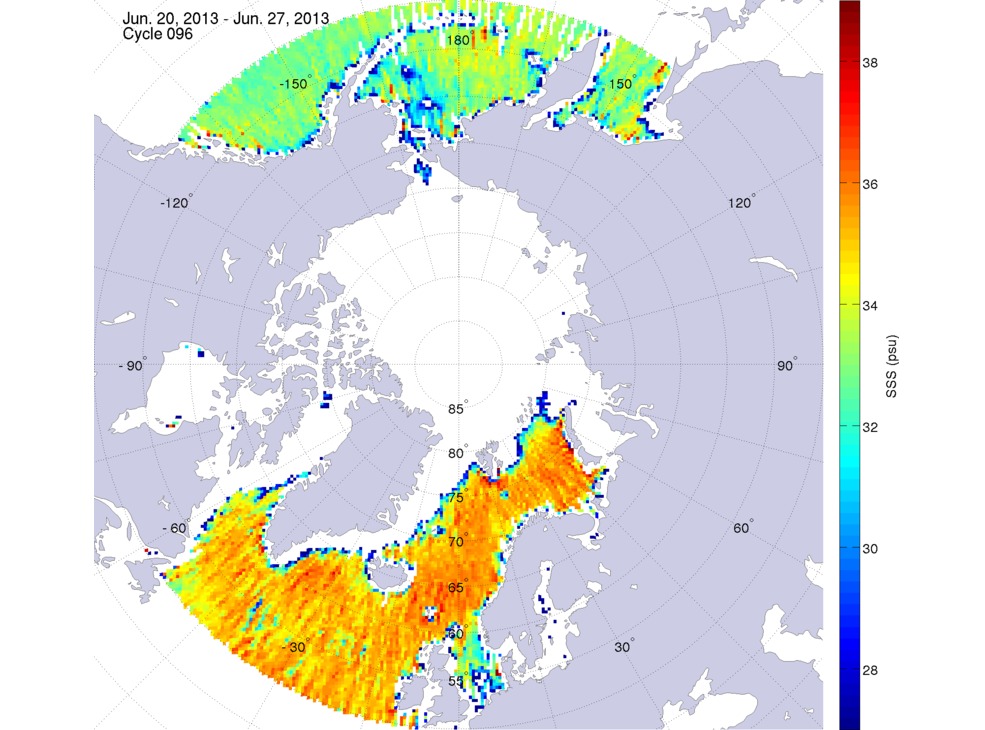 June 20, 2013 | |||
 June 13, 2013 | 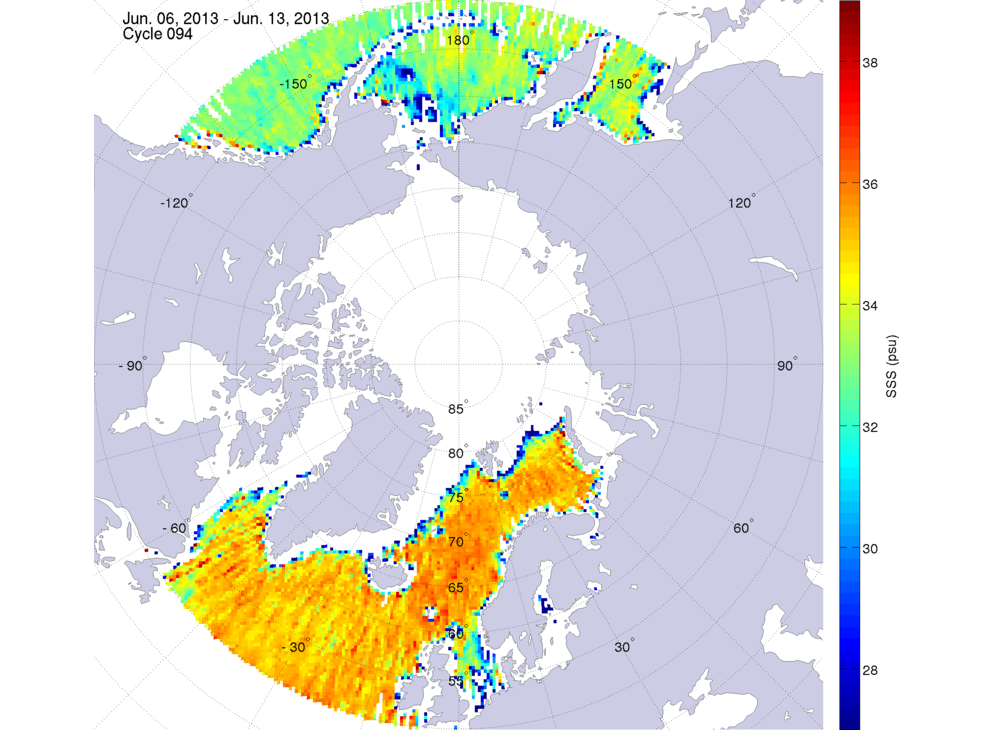 June 6, 2013 | 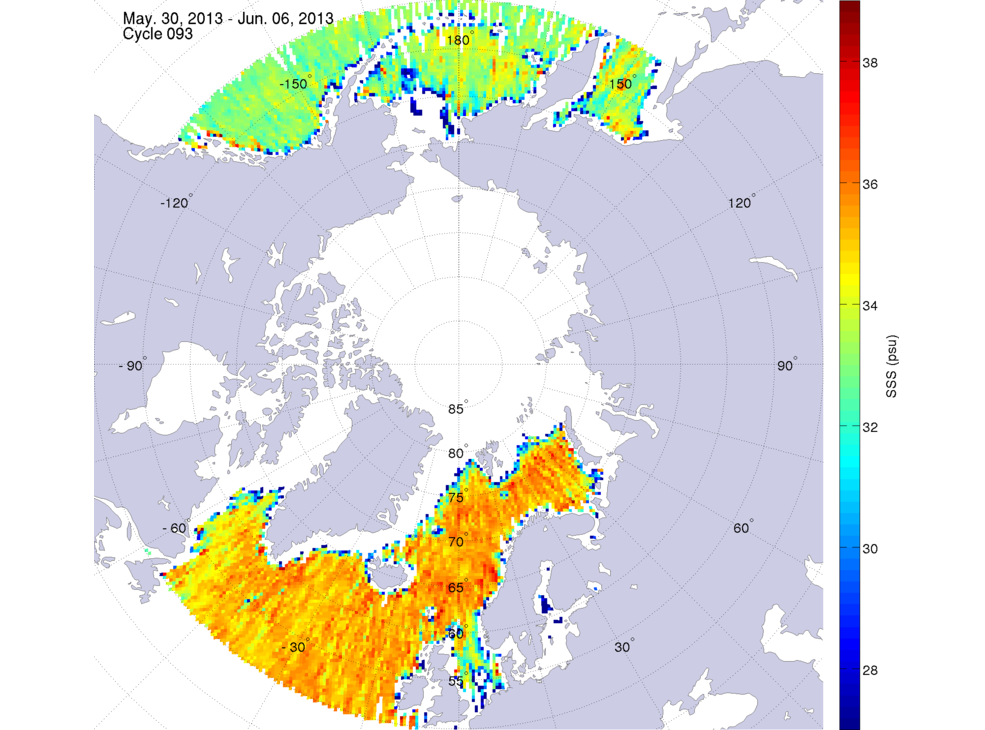 May 30, 2013 |  May 23, 2013 | |||
 May 16, 2013 |  May 9, 2013 | 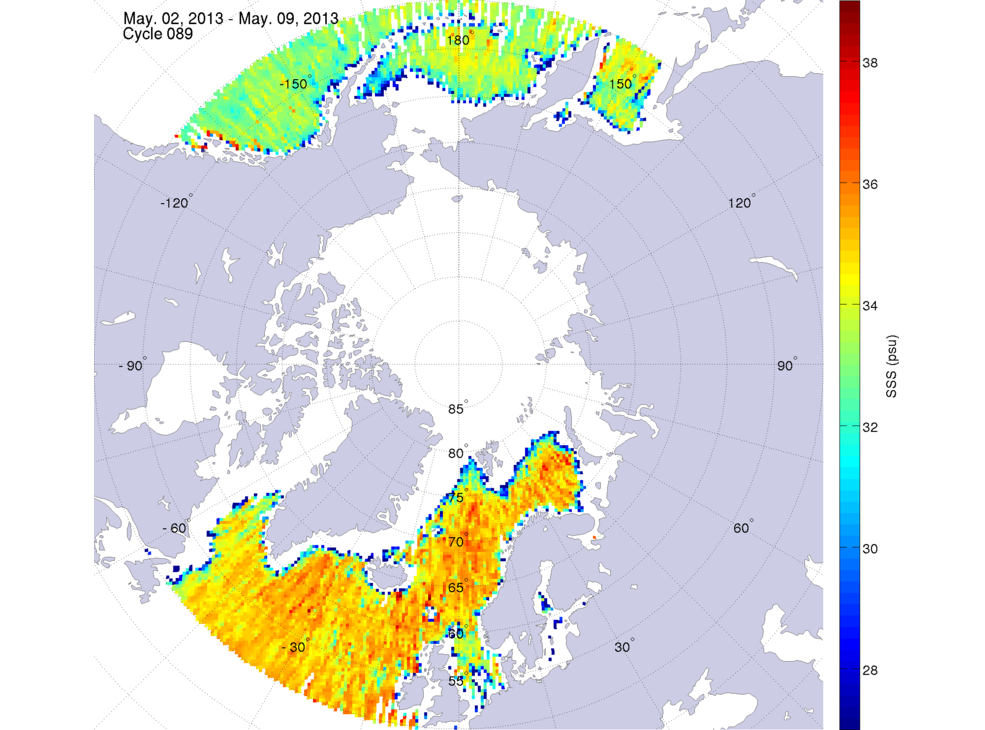 May 2, 2013 |  April 25, 2013 | |||
 April 18, 2013 | 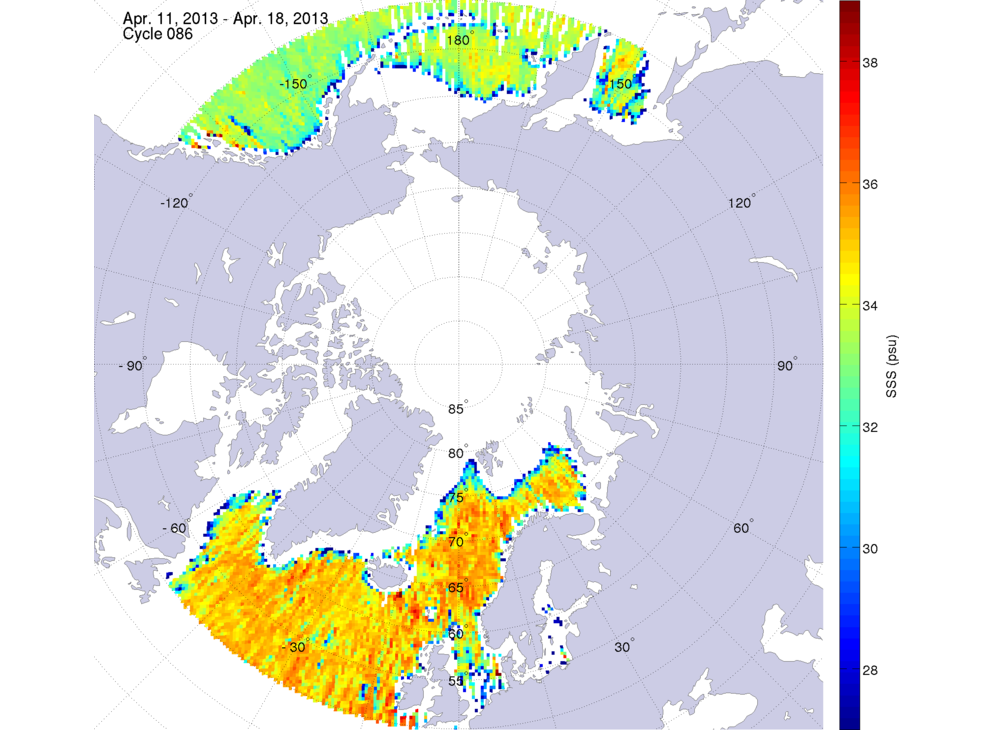 April 11, 2013 | 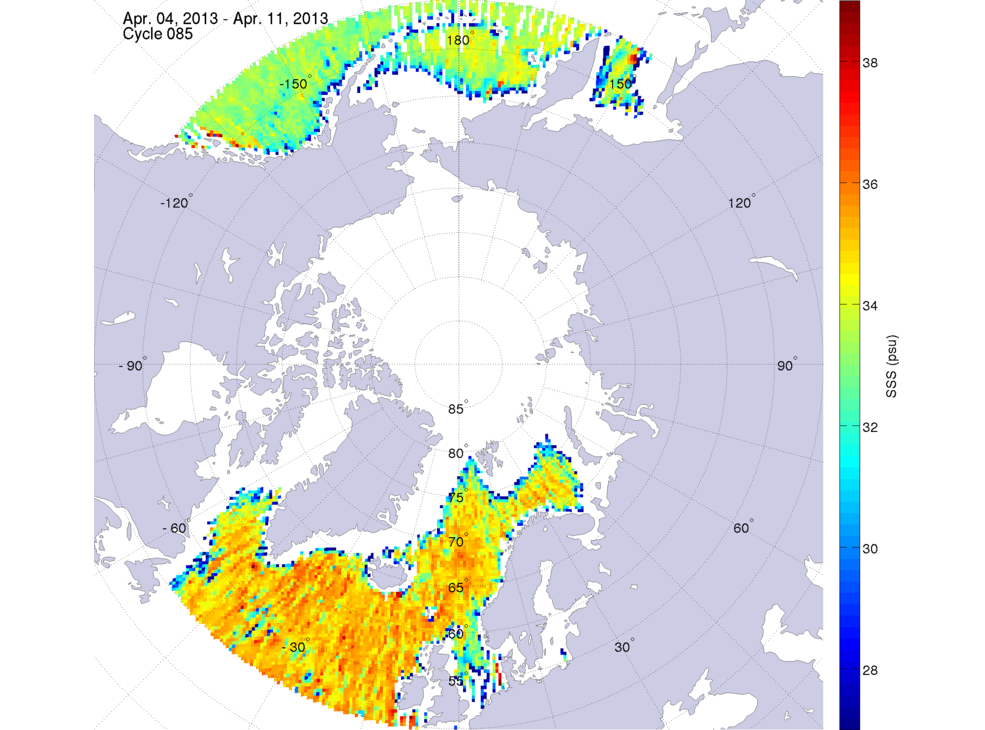 April 4, 2013 | 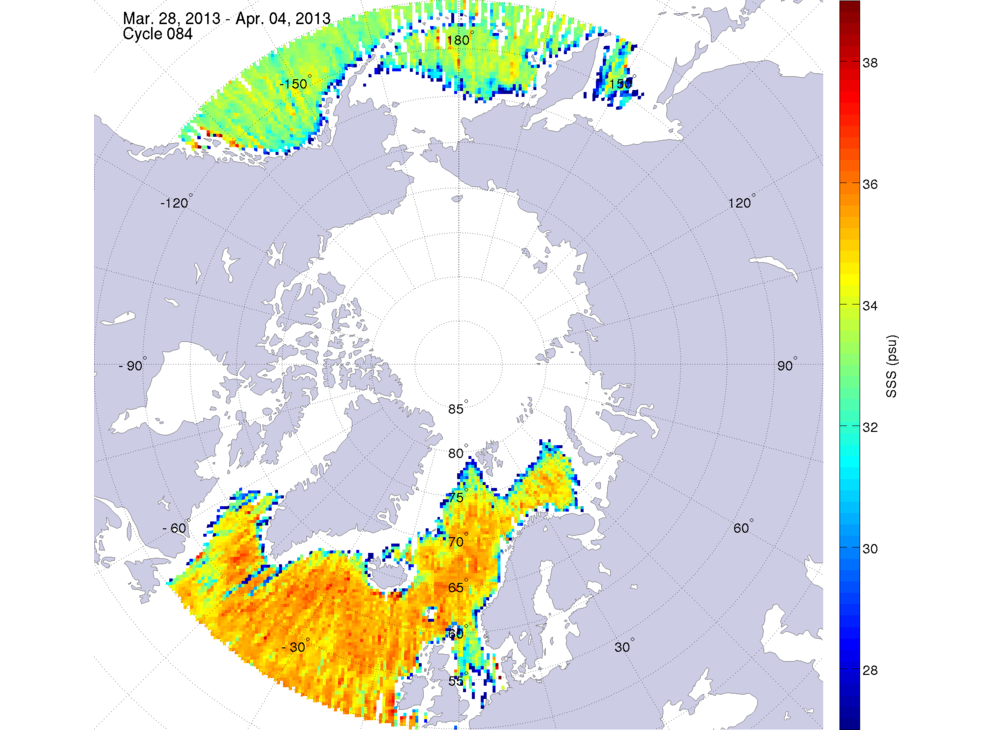 March 28, 2013 | |||
 March 21, 2013 |  March 14, 2013 |  March 7, 2013 | 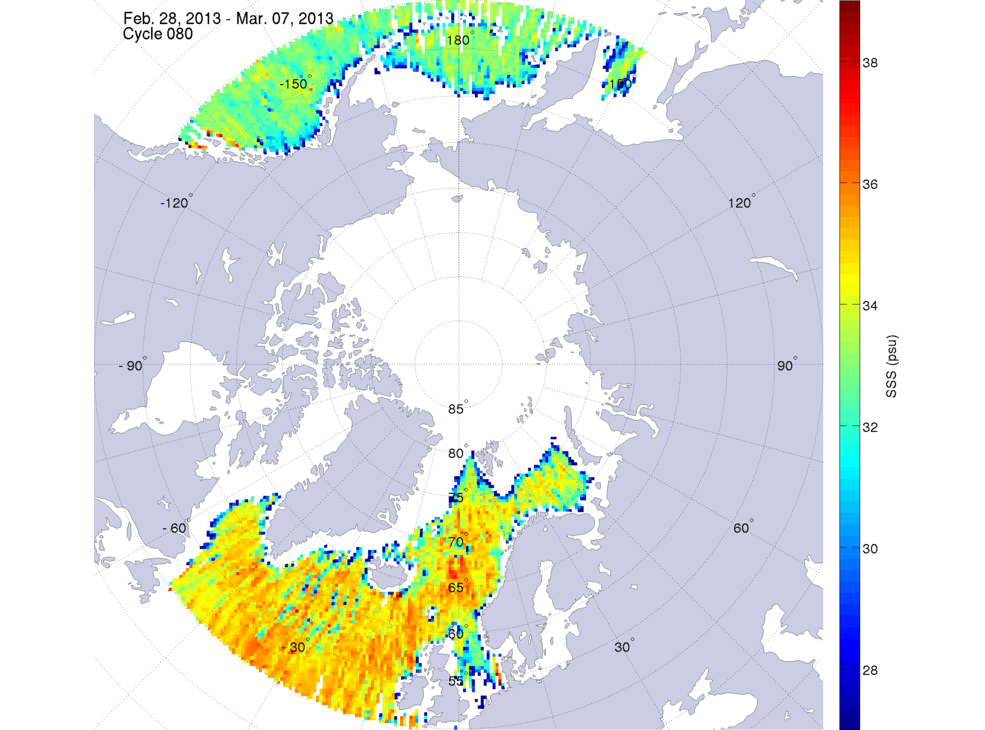 February 28, 2013 | |||
 February 21, 2013 | 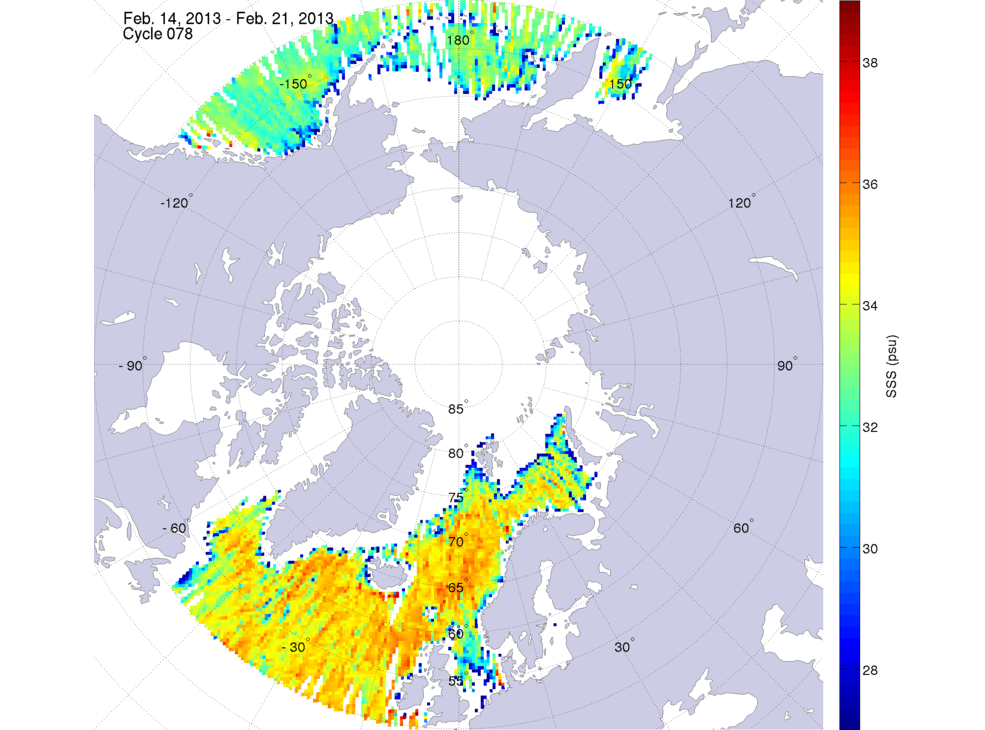 February 14, 2013 | 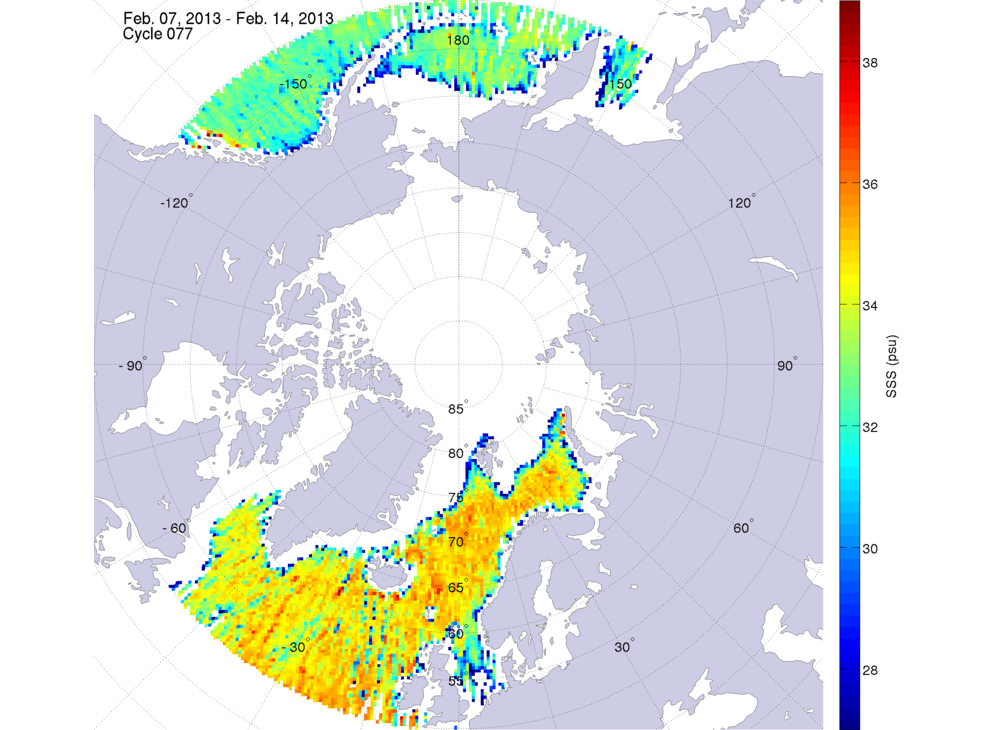 February 7, 2013 |  January 31, 2013 | |||
 January 24, 2013 | 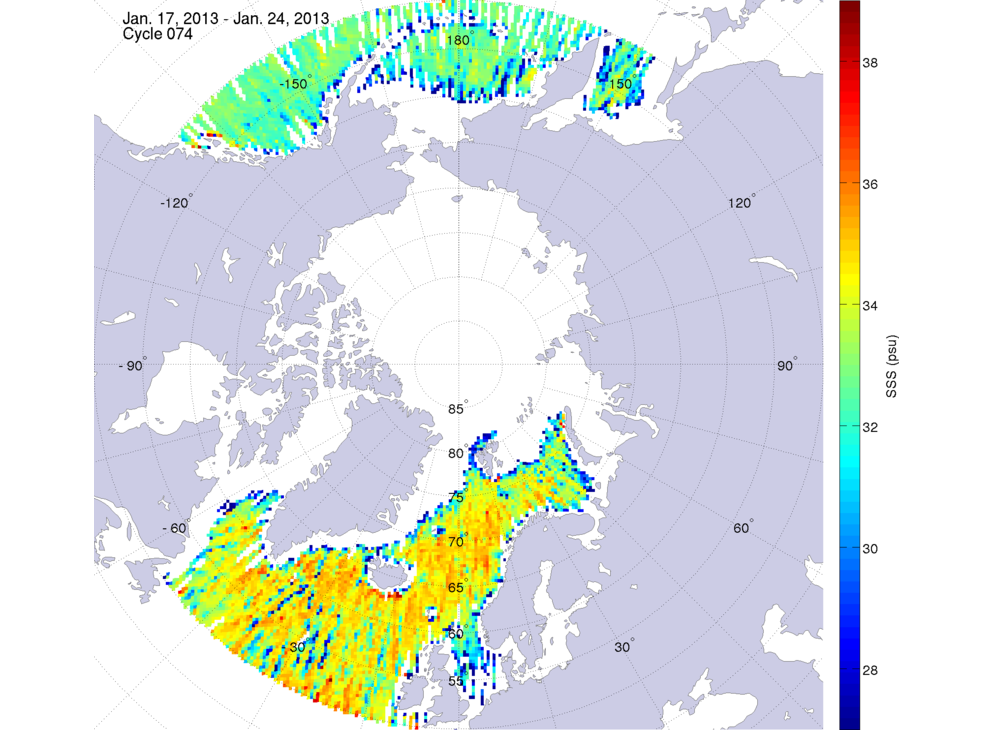 January 17, 2013 | 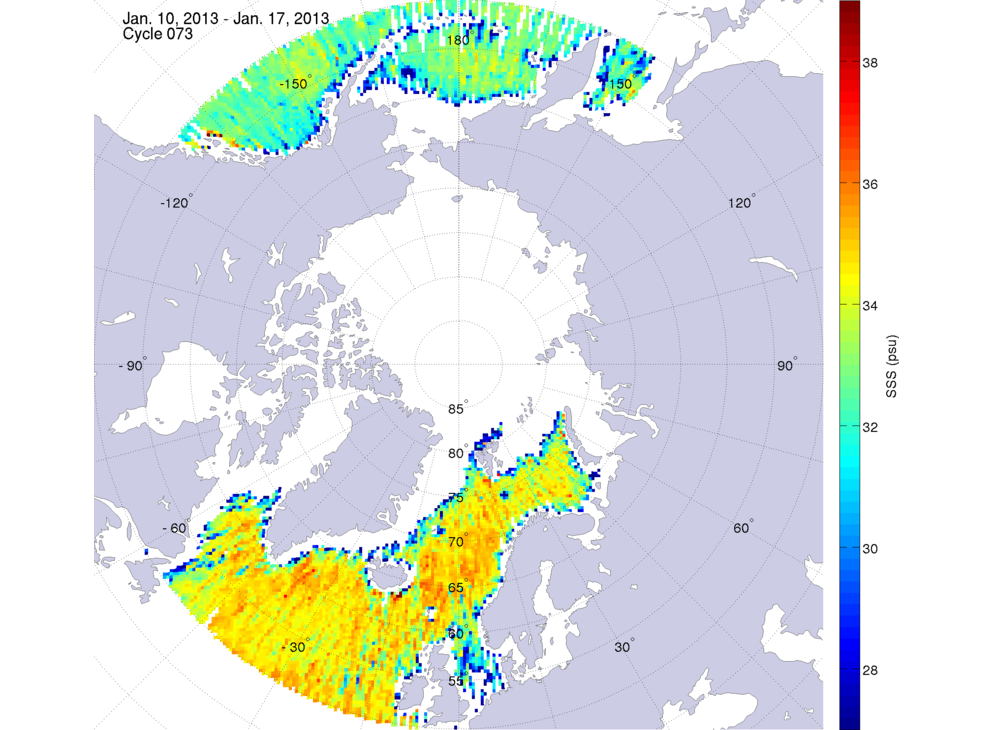 January 10, 2013 | 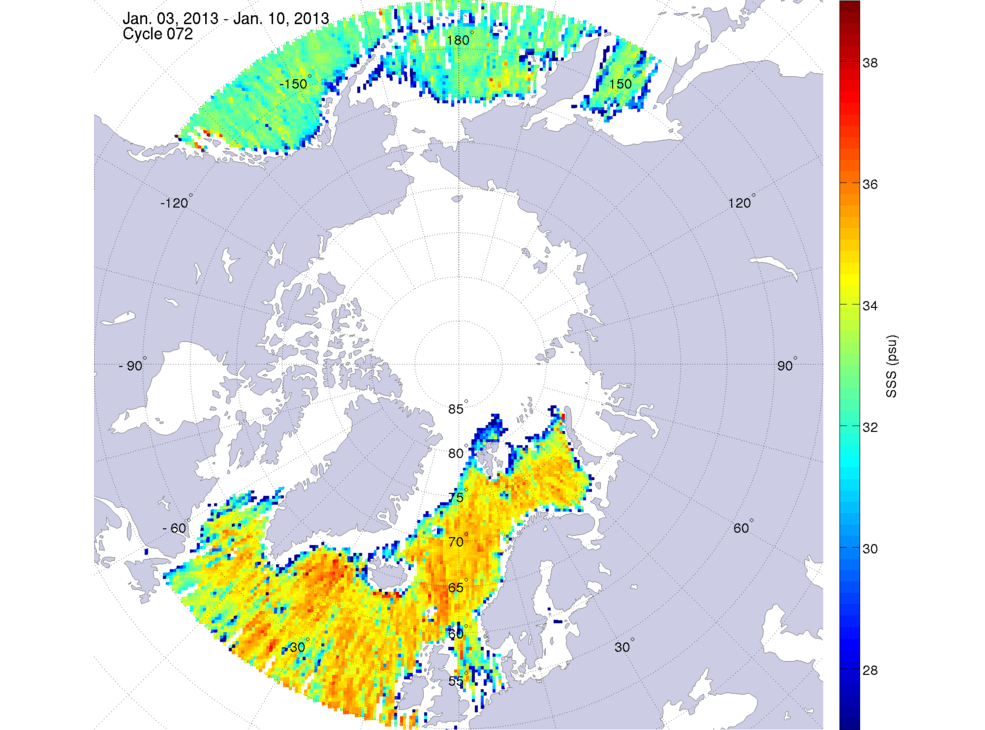 January 3, 2013 | |||
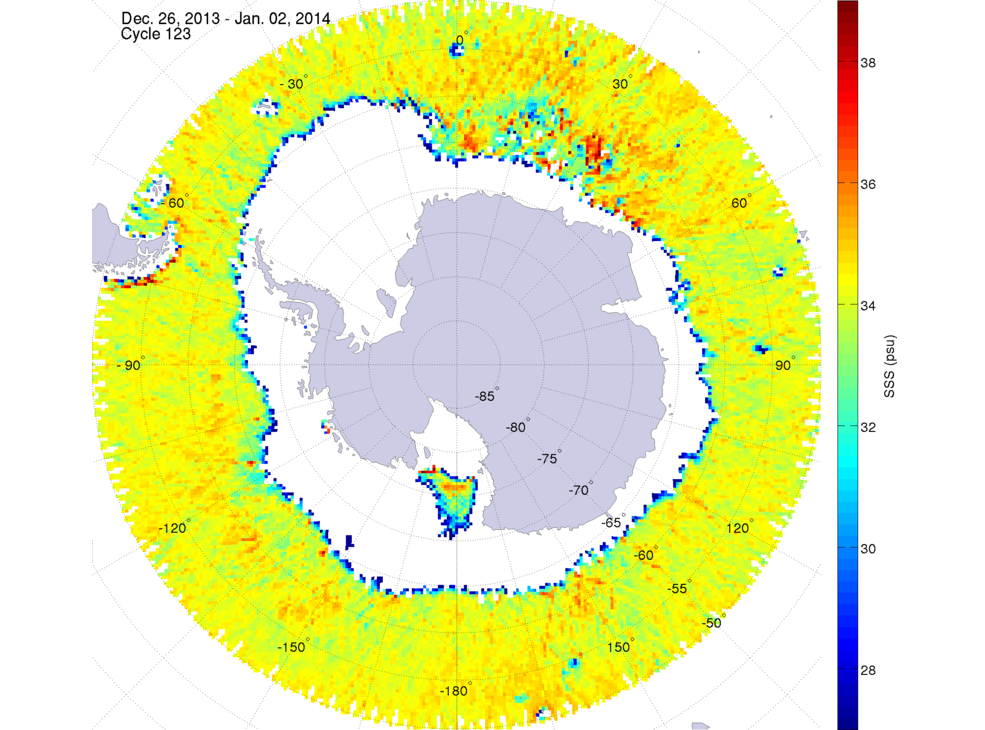
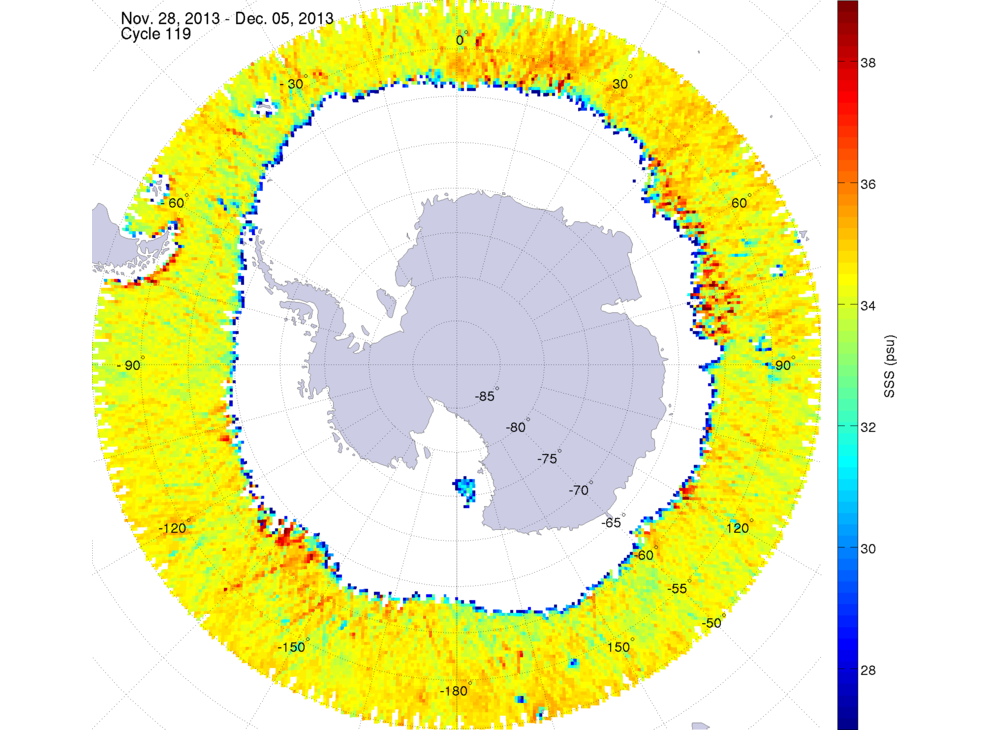
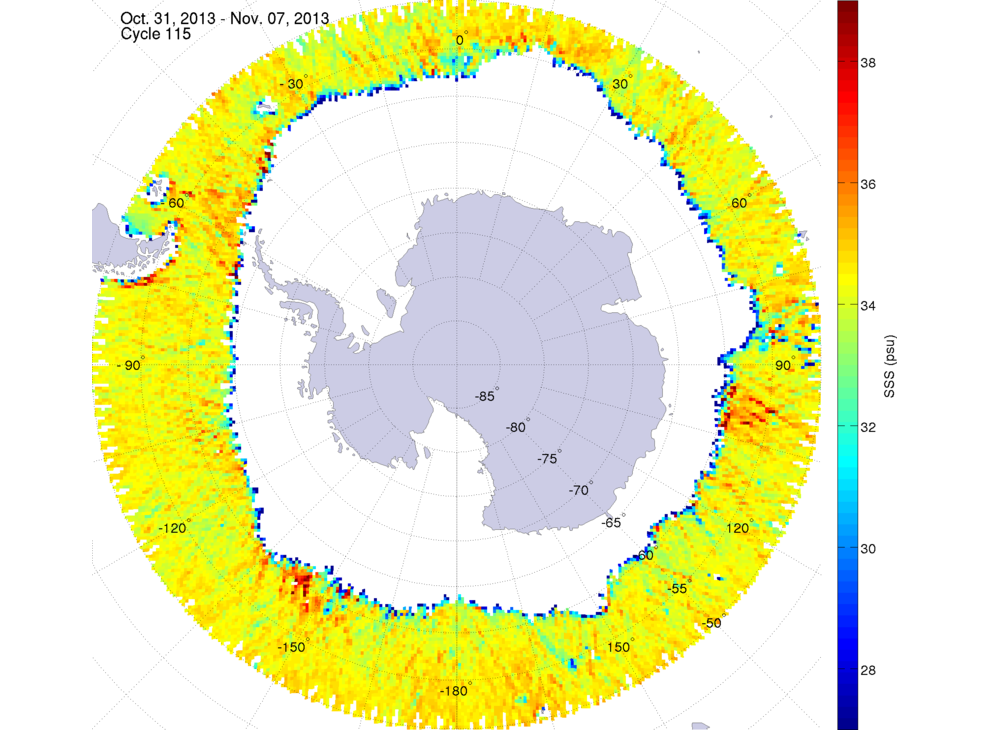
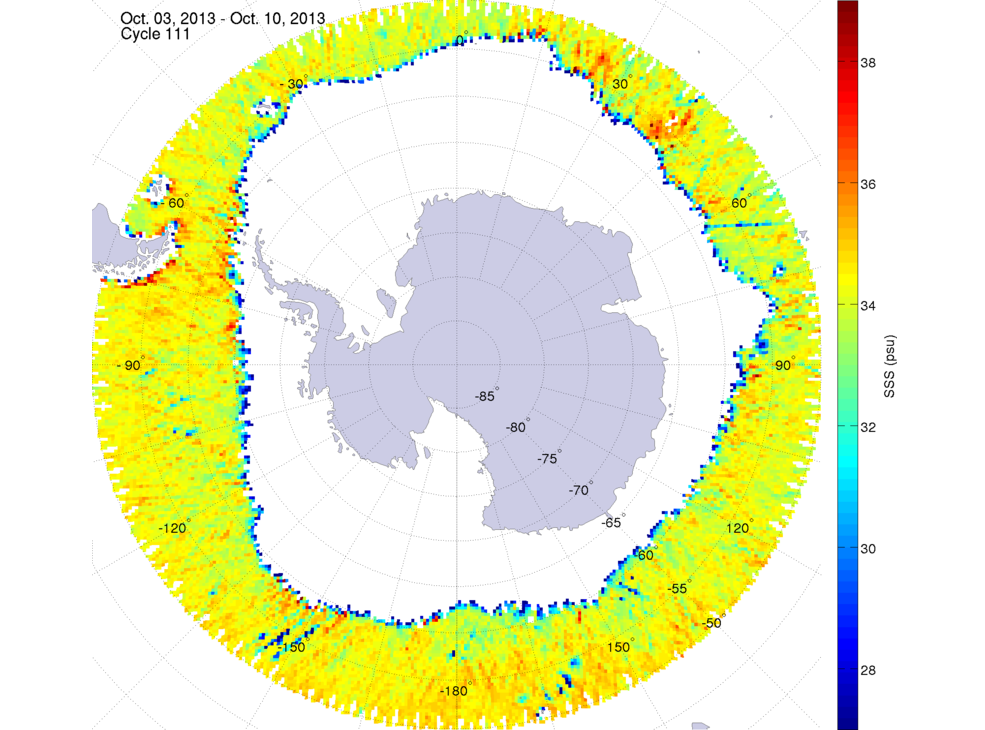
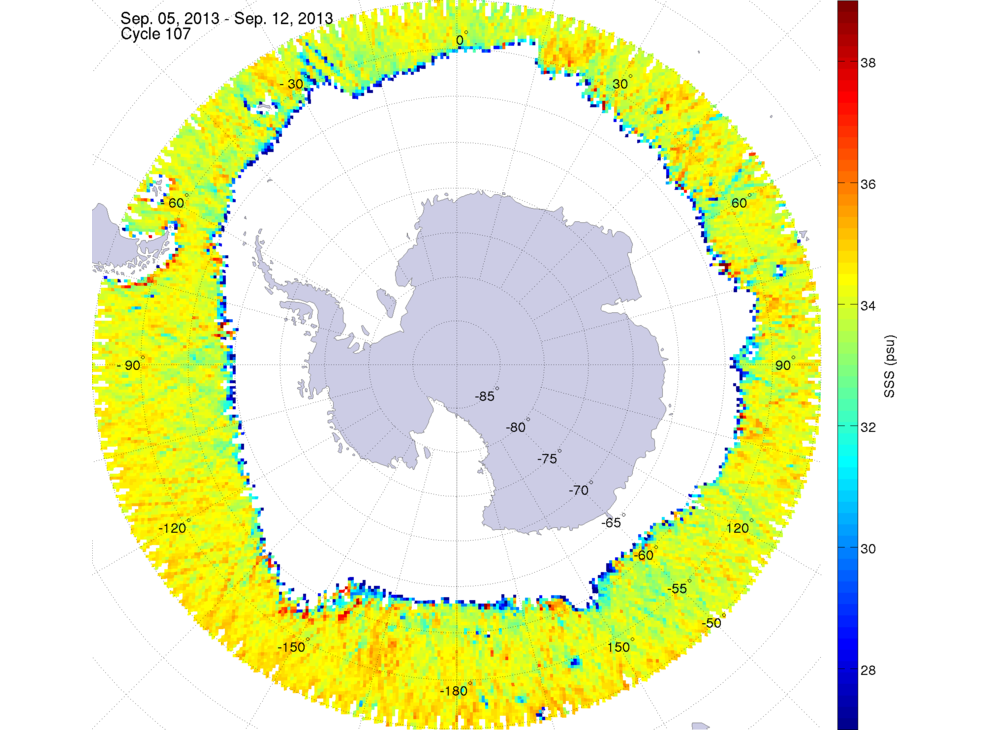
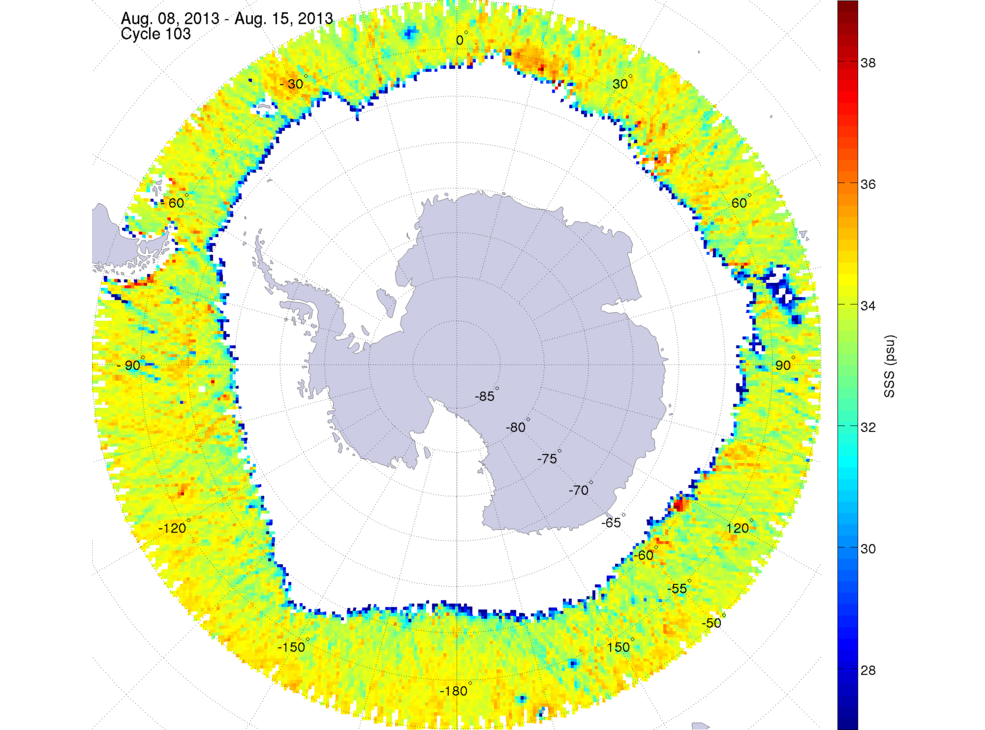
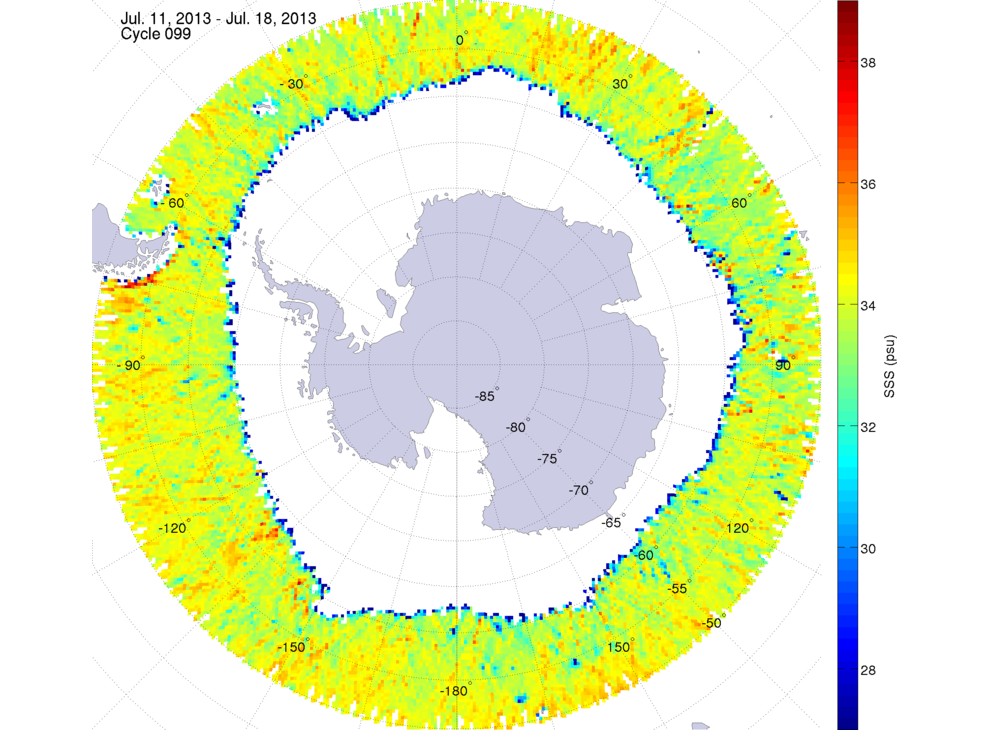
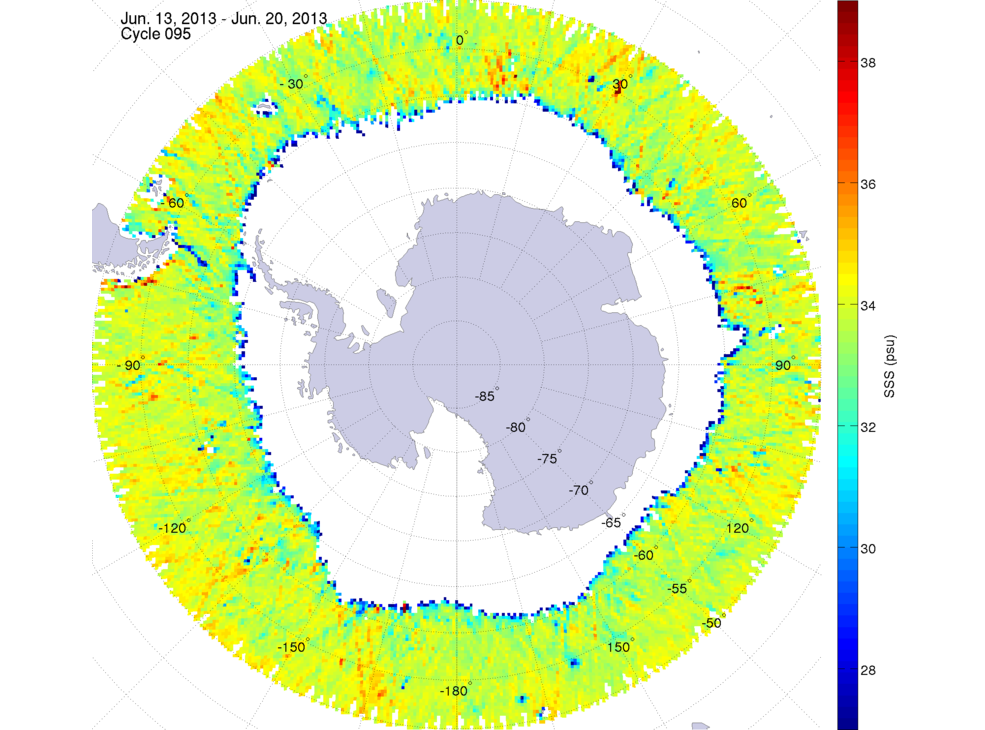
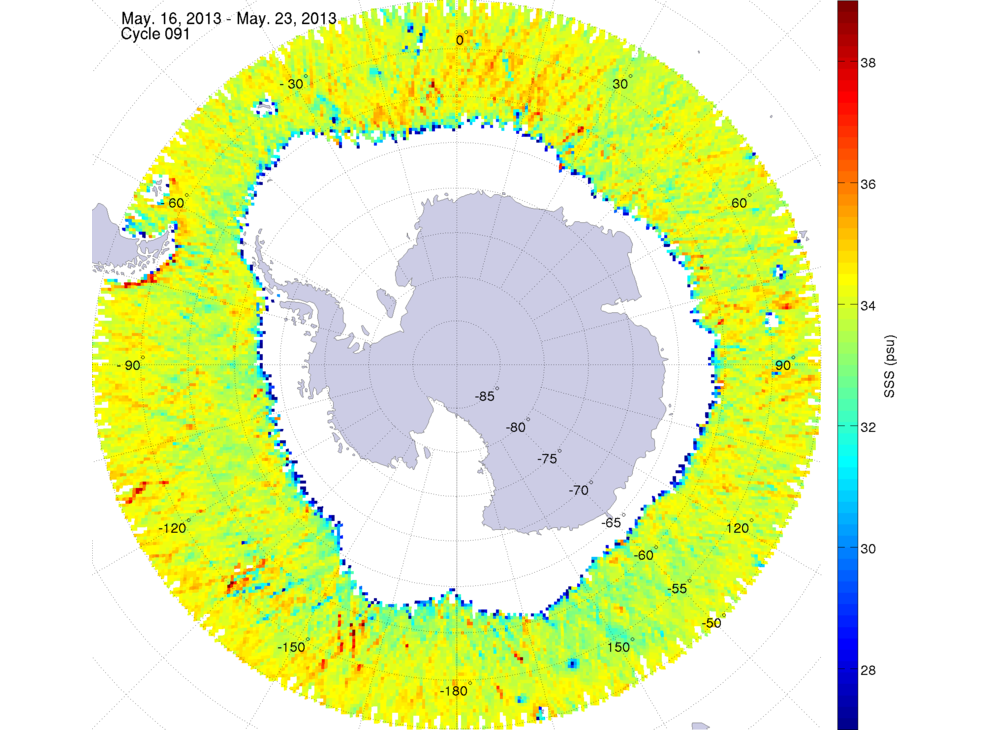
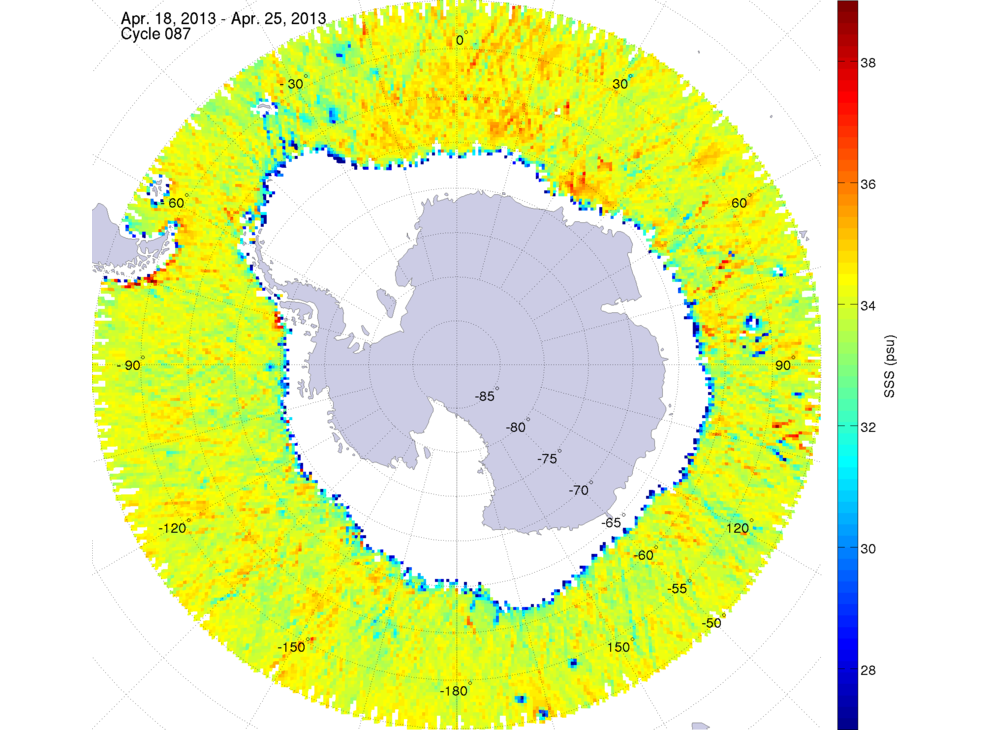
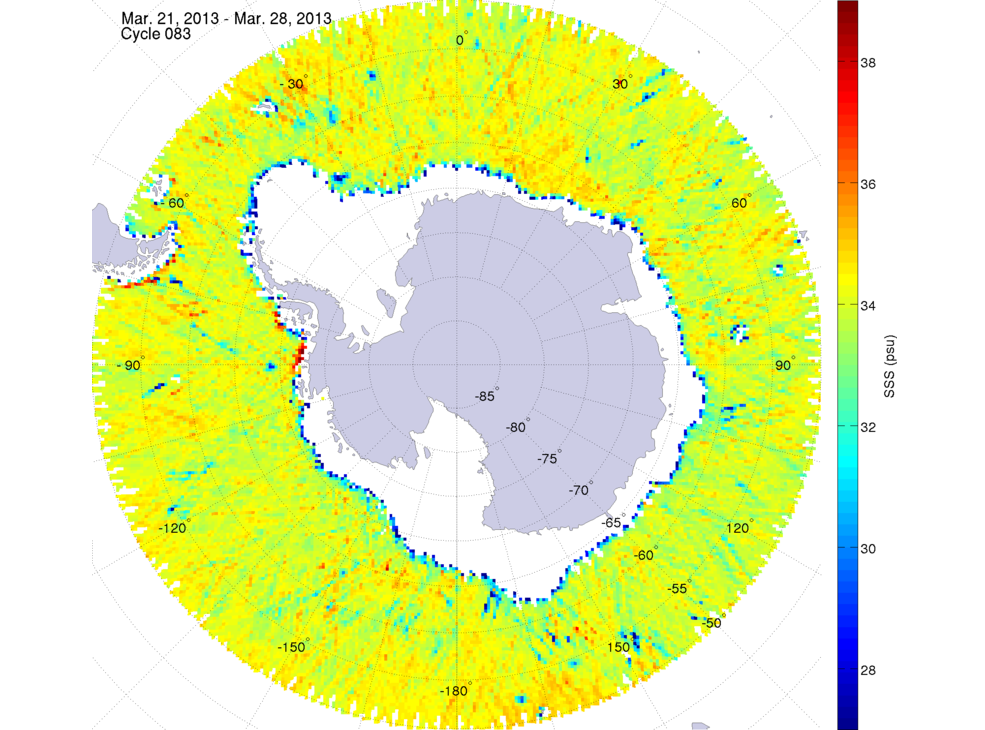
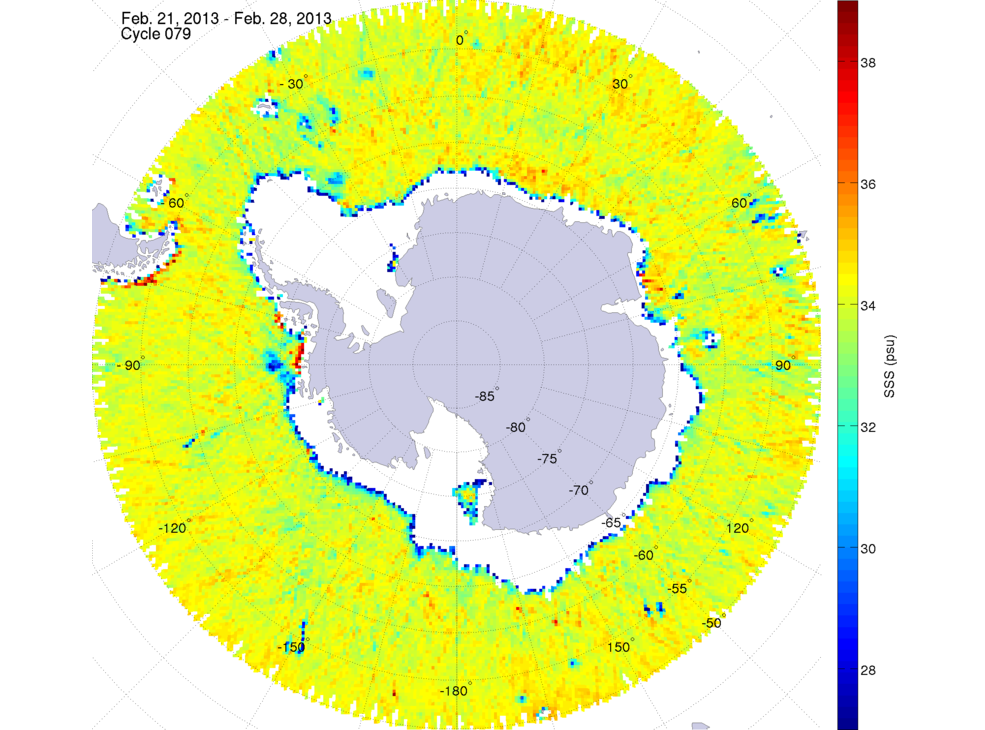
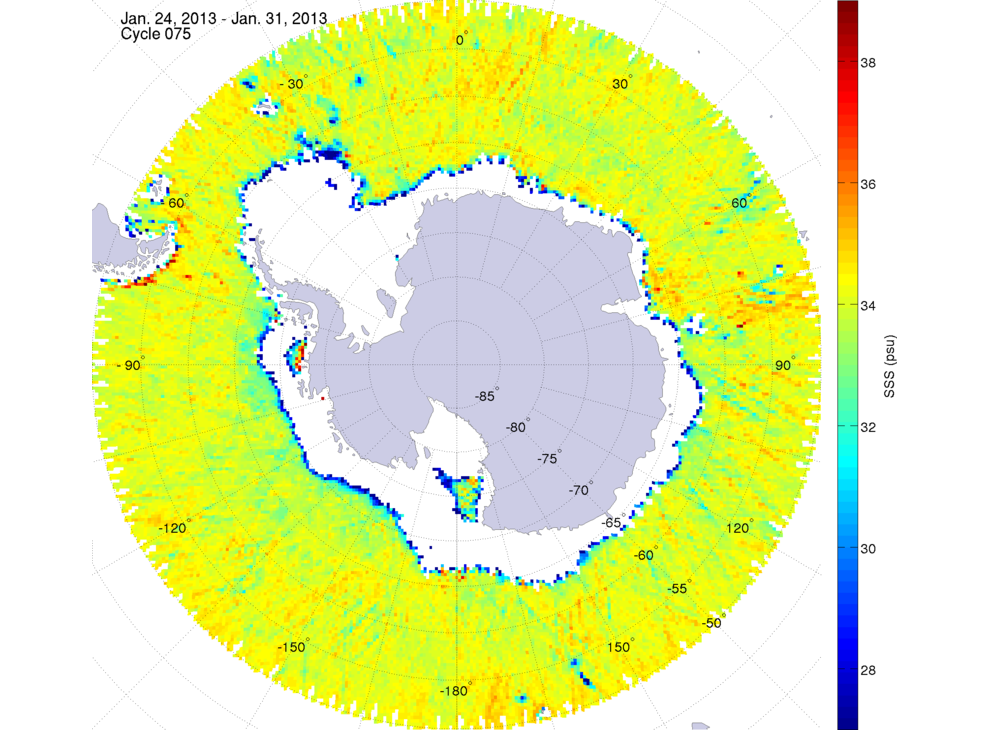
Aquarius Retrieved Sea Surface Salinity in the Southern High-Latitude Ocean
The Southern Ocean is an important source for deep water formations, and therefore the thermohaline circulation. Downwelling
of upper layer water is induced by surface cooling and salt rejection during the formation and growth of sea ice. However, sea
surface salinity retrieval in the Southern Ocean is challenging. There are strong winds, and the circulation in the Southern
Ocean is dominated by the Antarctic Circumpolar Current, which is regarded as the largest World's ocean current. Salinity
retrieval is less accurate for very rough sea surfaces. In addition, waters around Antarctica are cold. Aquarius measurements
are less sensitive to salinity in cold waters. Finally, the presence of sea ice add an additional complexity to the monitoring
of salinity in the high latitudes of the Southern Hemisphere.2013 Maps: Southern Hemisphere | ||||||
 December 26, 2013 | 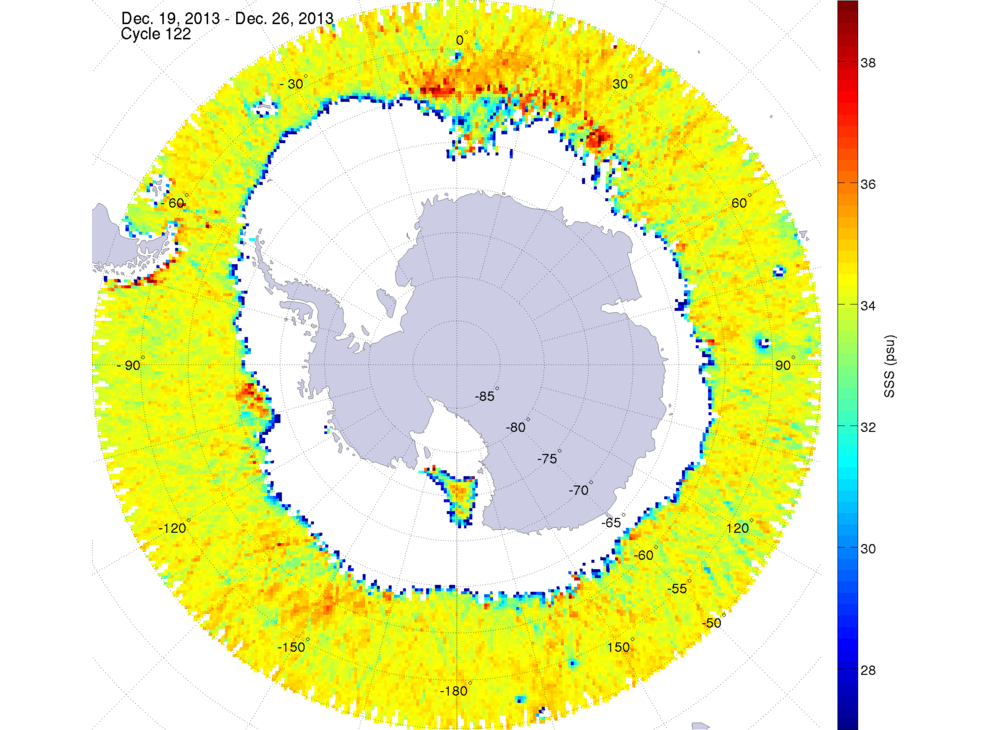 December 19, 2013 | 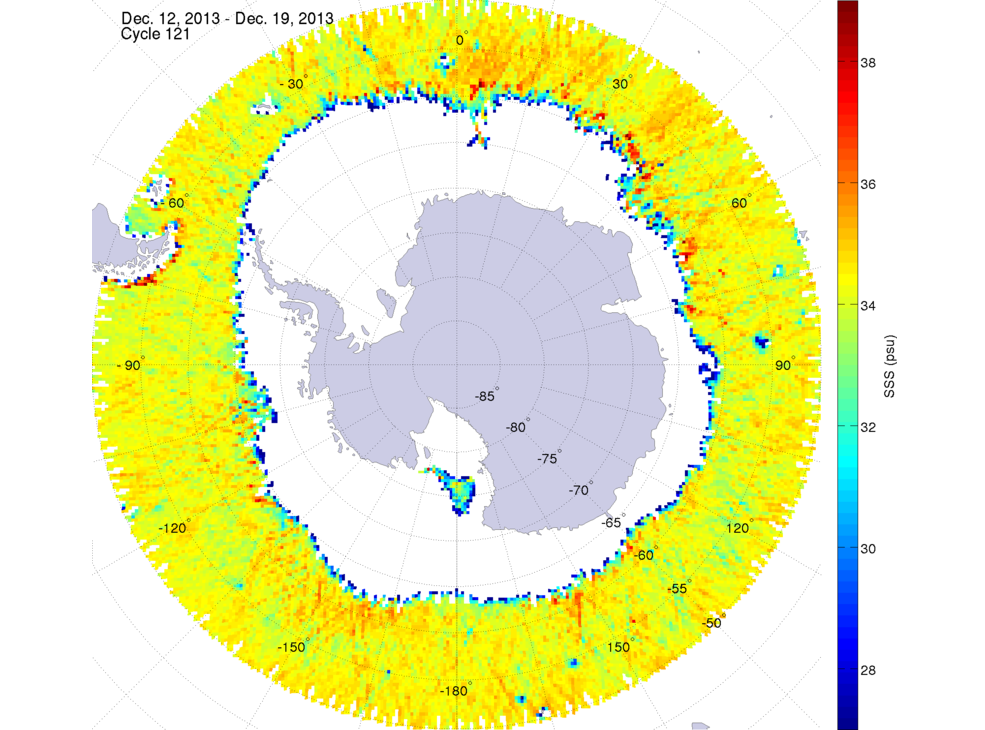 December 12, 2013 | 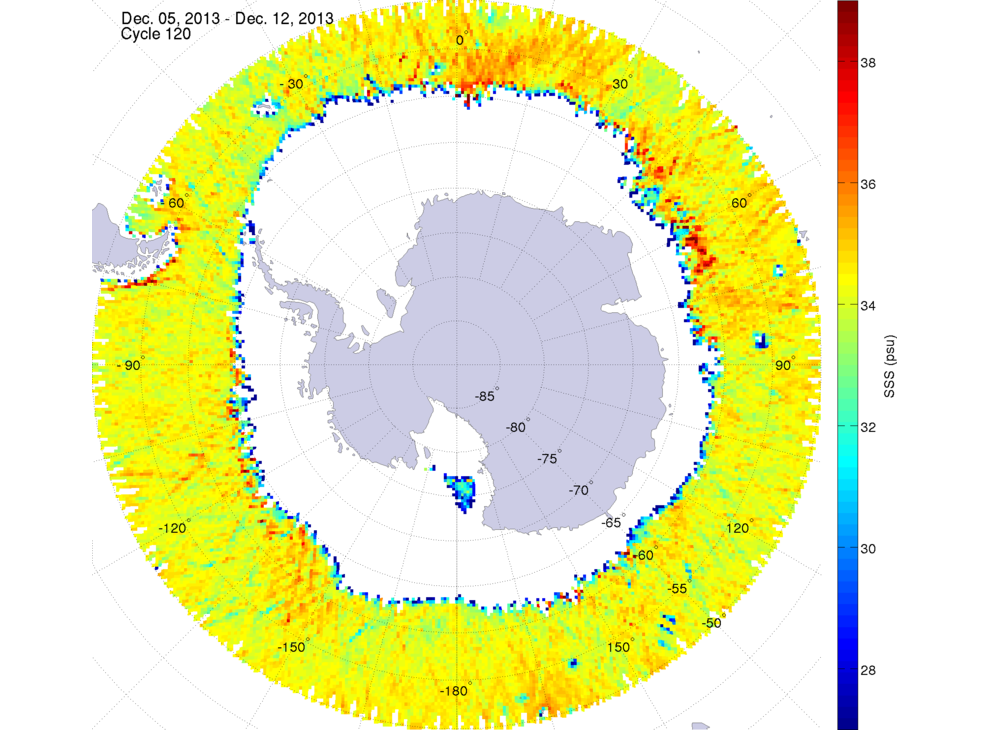 December 5, 2013 | |||
 November 28, 2013 | 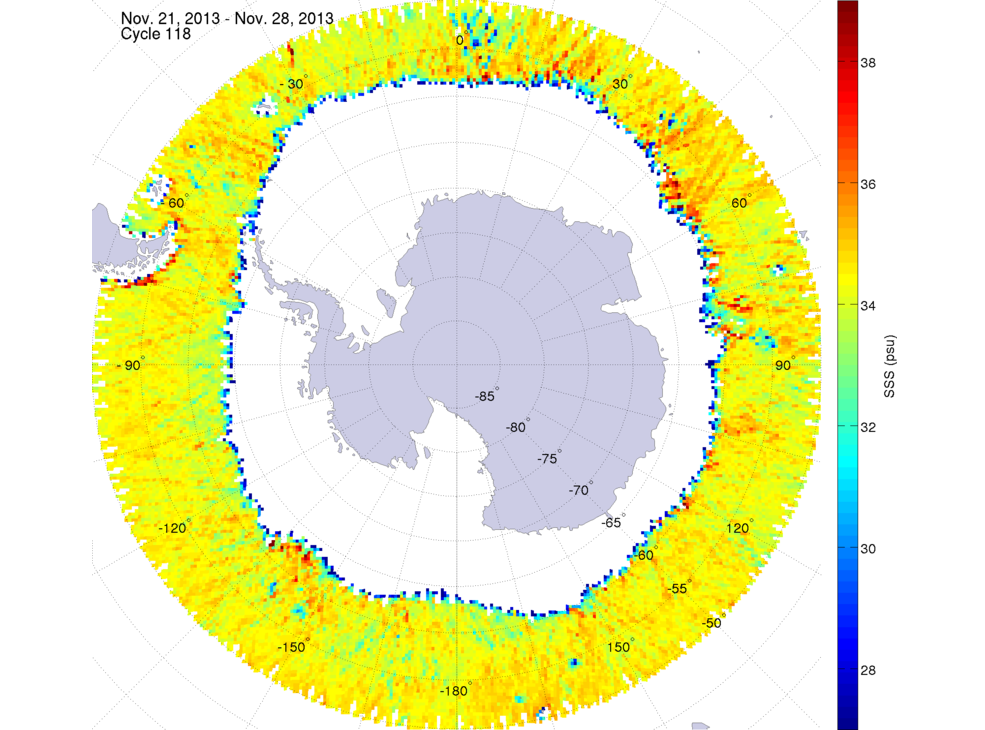 November 21, 2013 | 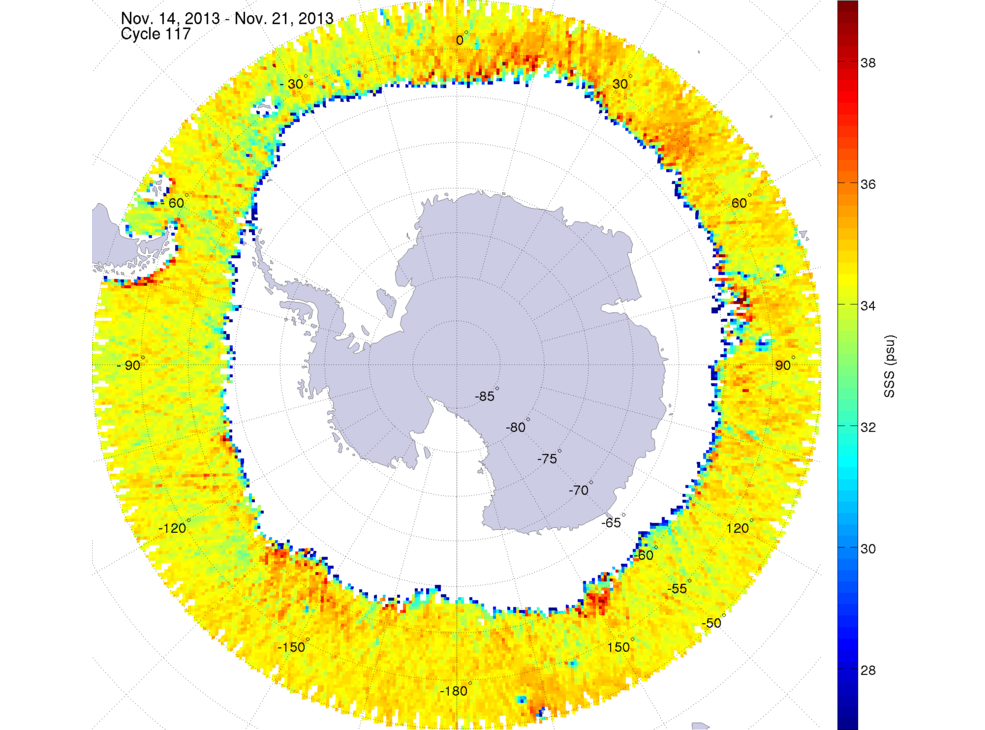 November 14, 2013 | 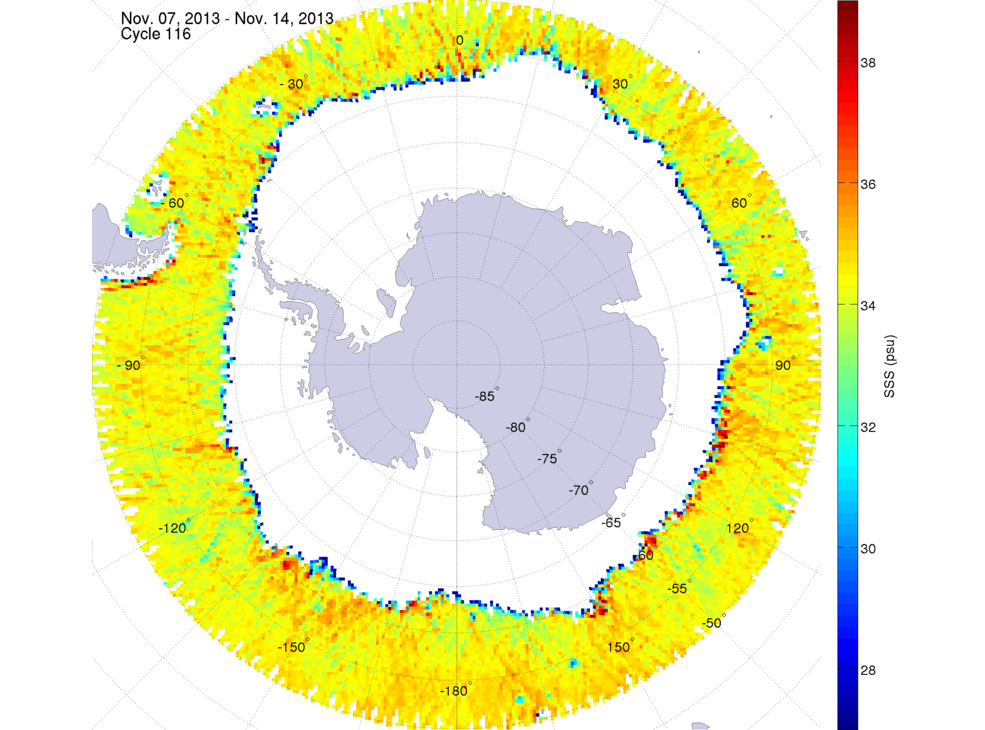 November 7, 2013 | |||
 October 31, 2013 | 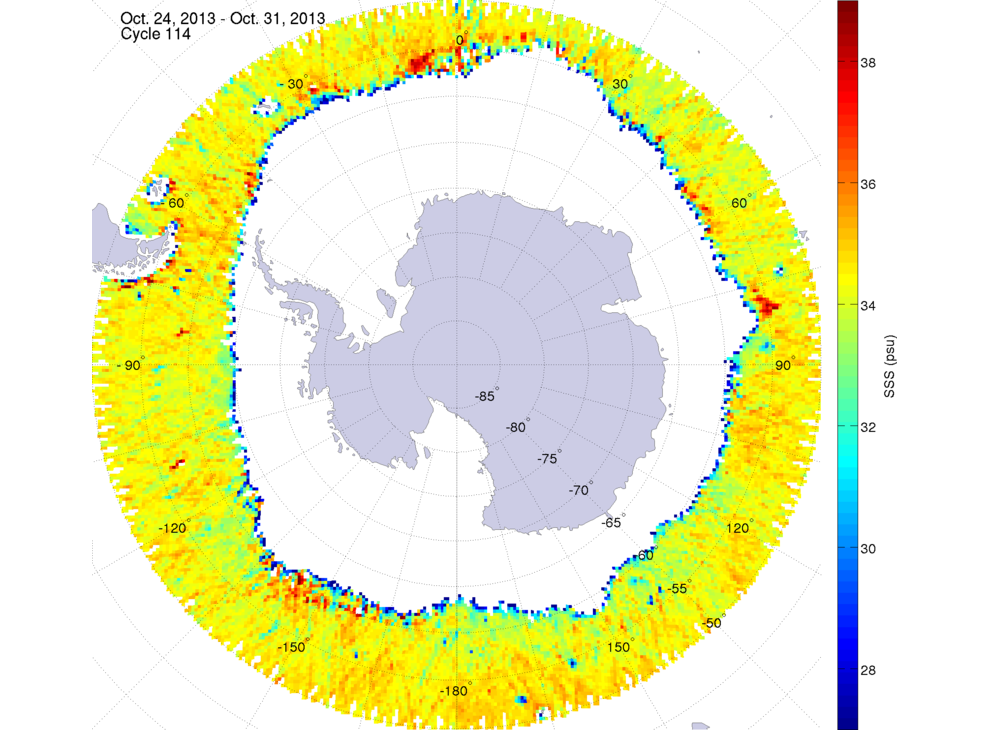 October 24, 2013 | 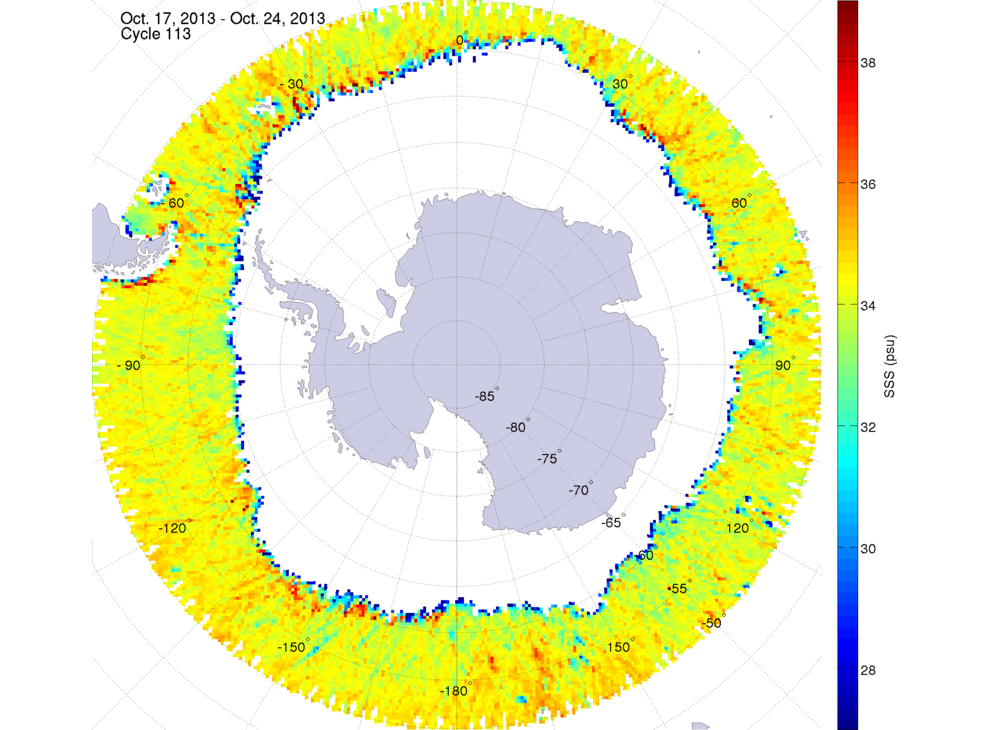 October 17, 2013 | 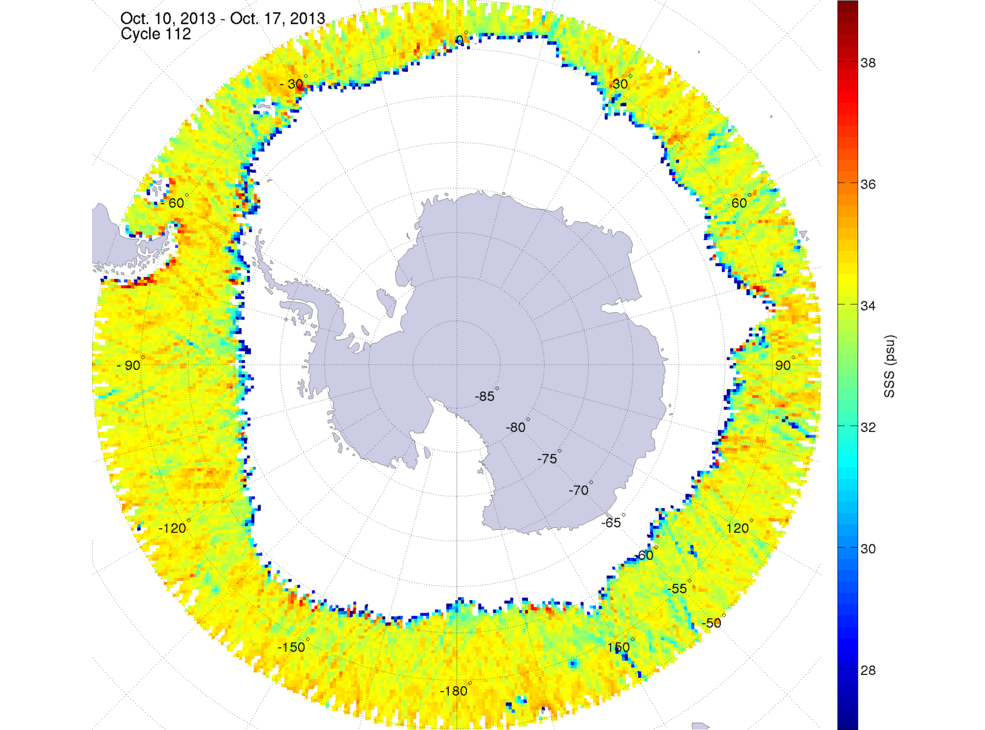 October 10, 2013 | |||
 October 3, 2013 | 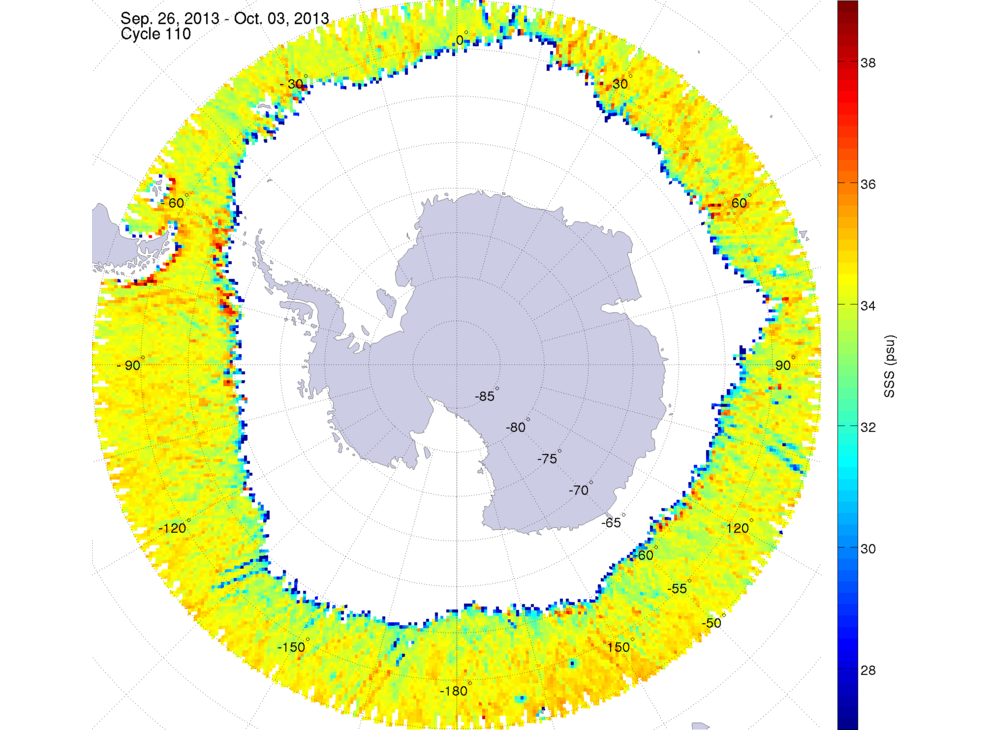 September 26, 2013 | 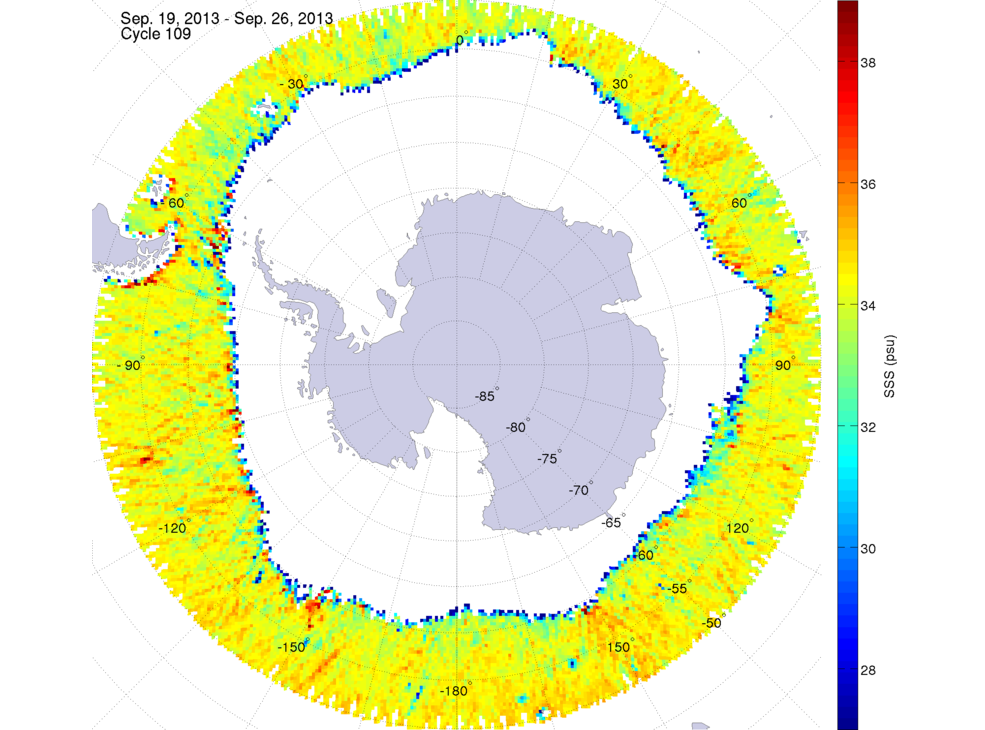 September 19, 2013 | 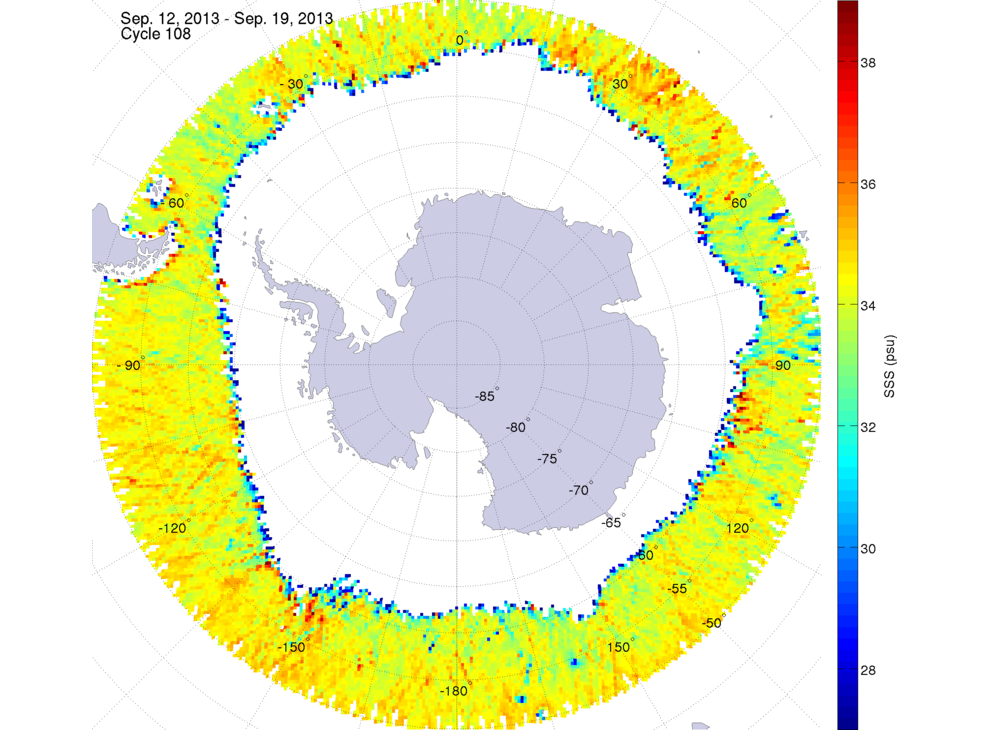 September 12, 2013 | |||
 September 5, 2013 | 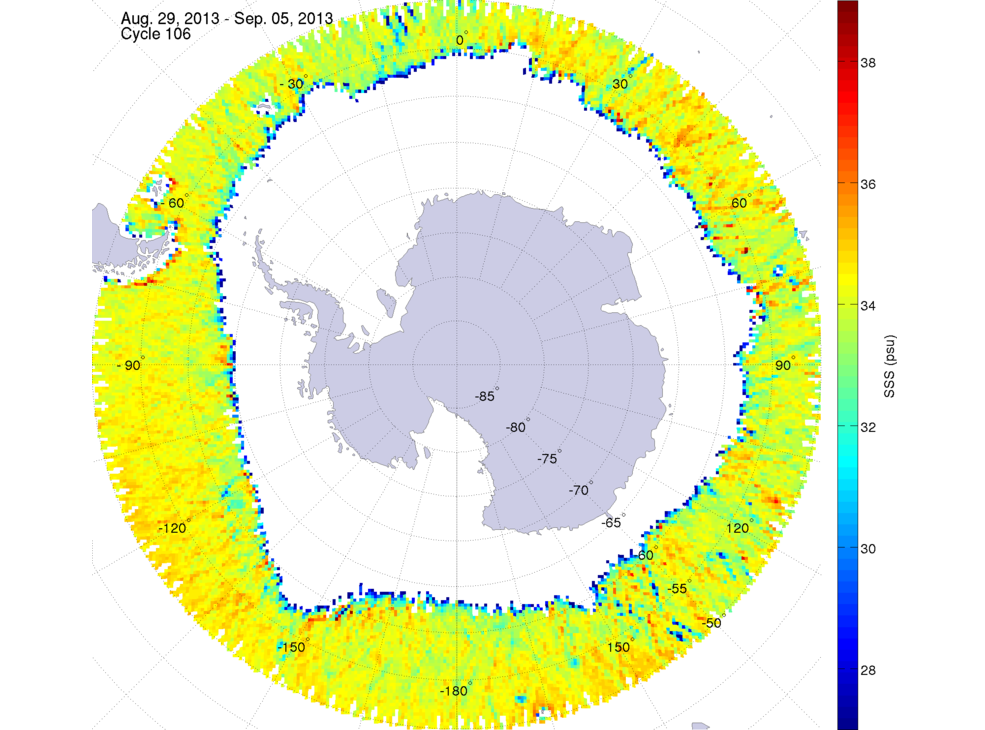 August 29, 2013 | 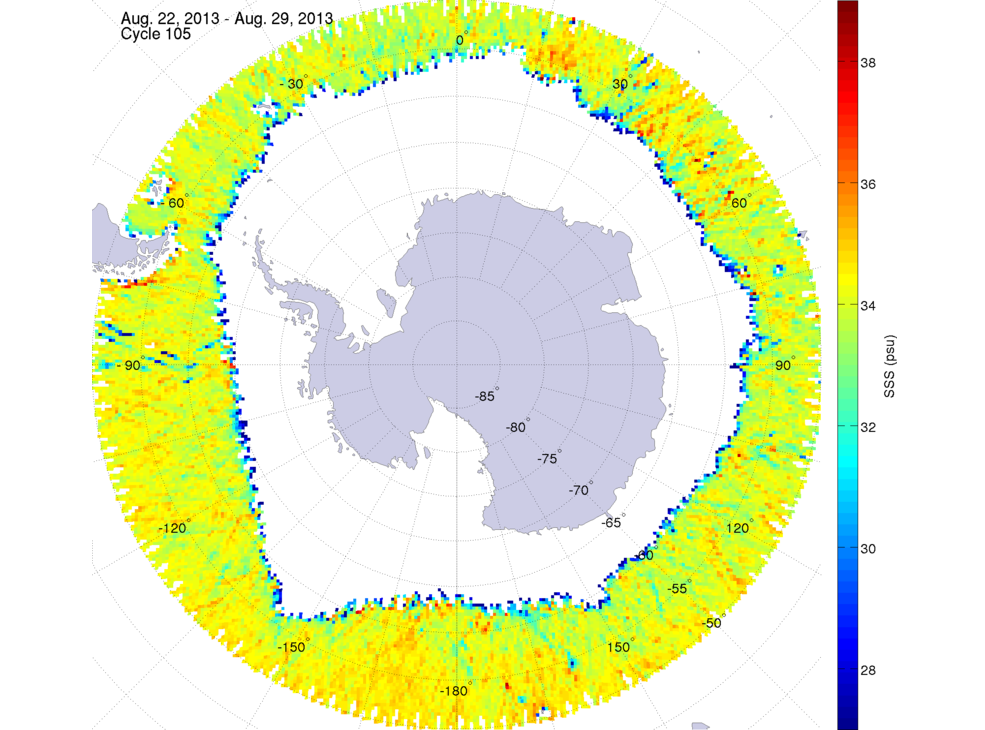 August 22, 2013 | 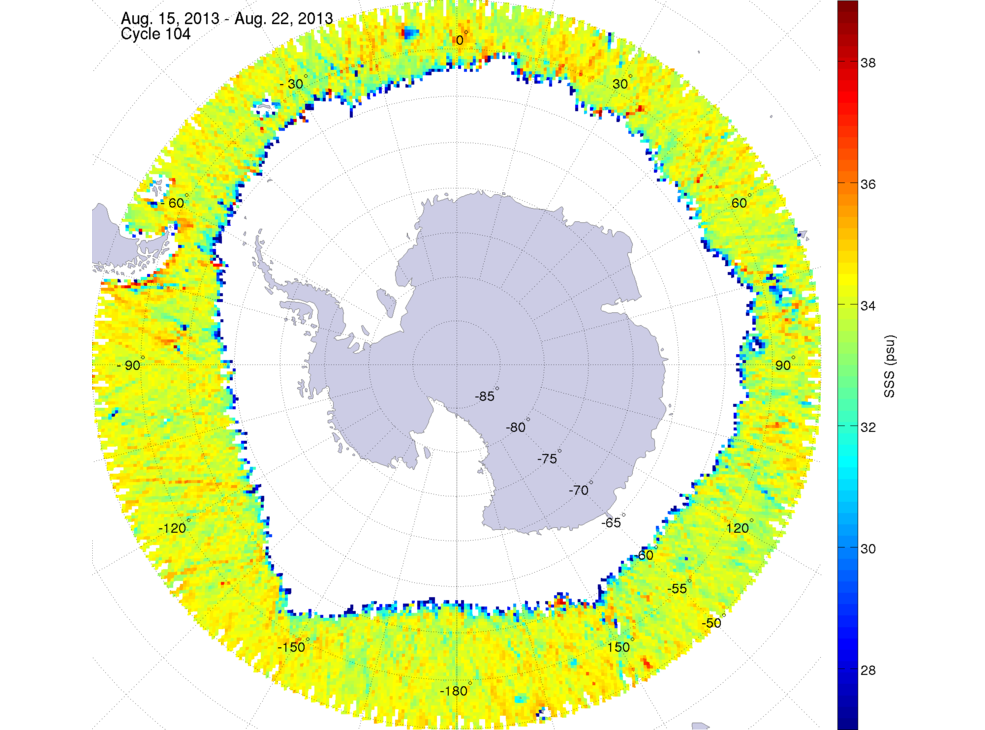 August 15, 2013 | |||
 August 8, 2013 | 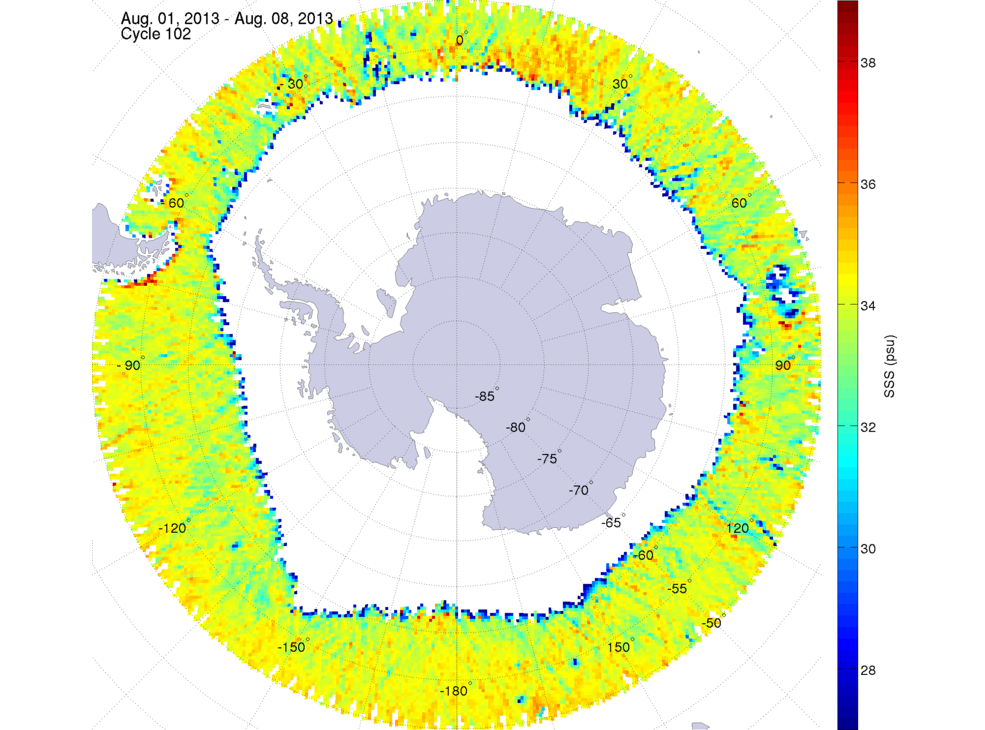 August 1, 2013 | 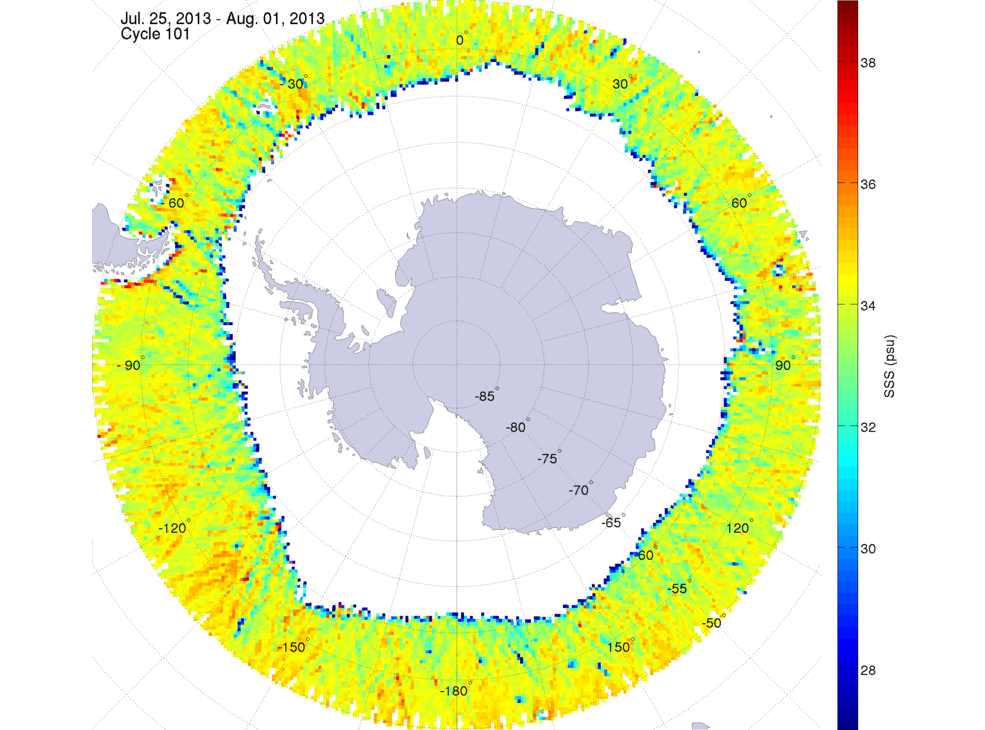 July 25, 2013 | 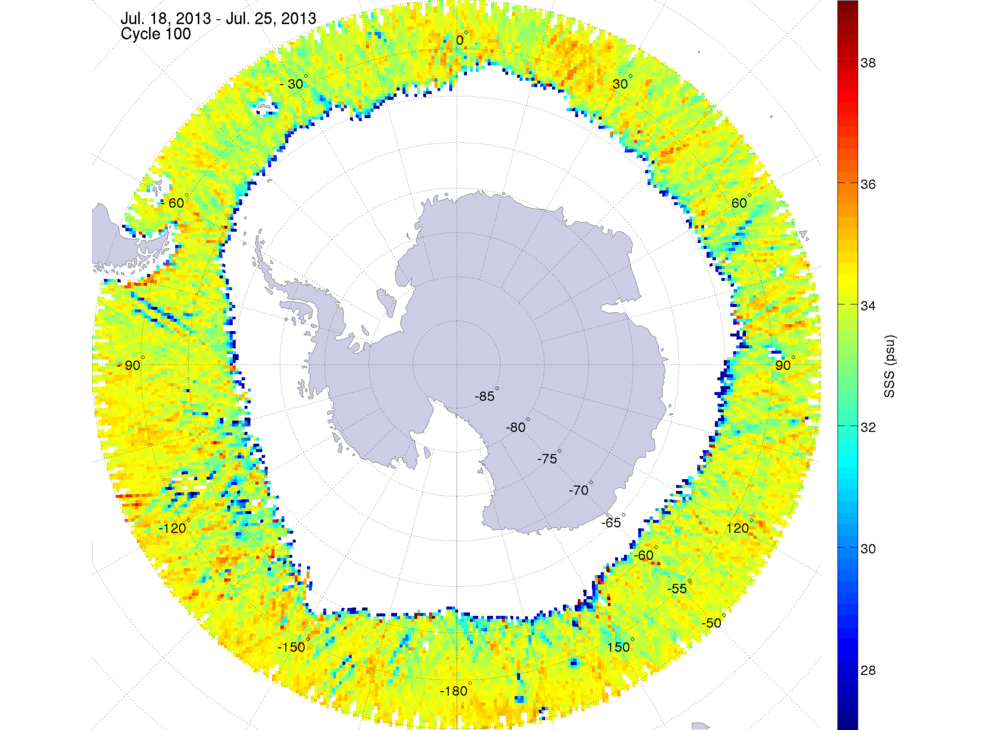 July 18, 2013 | |||
 July 11, 2013 | 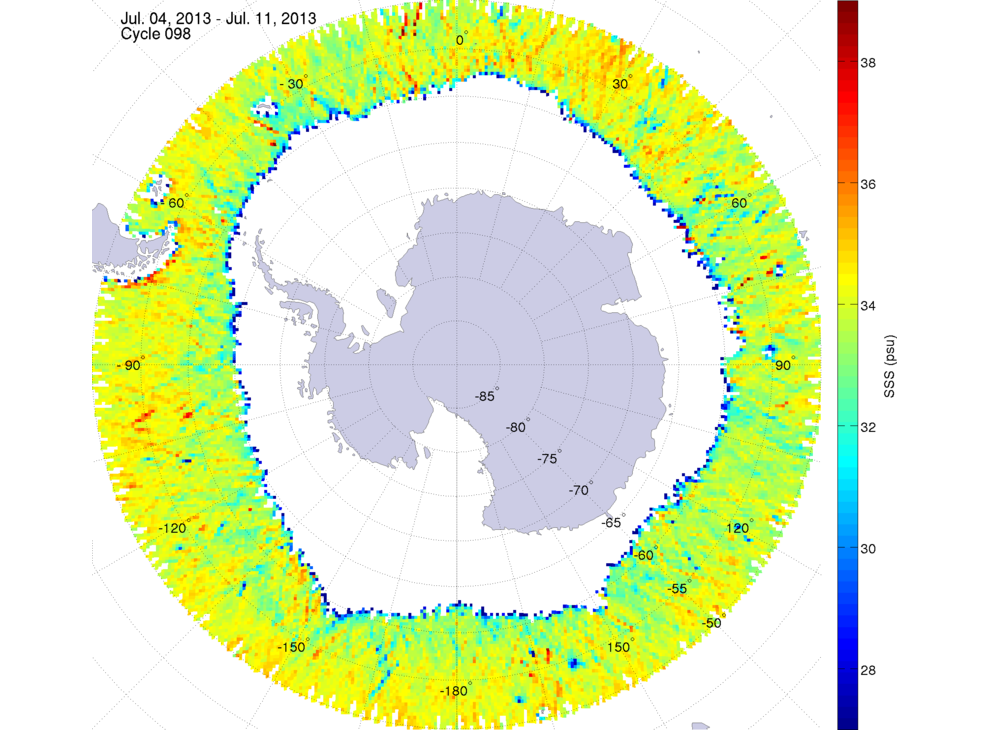 July 4, 2013 | 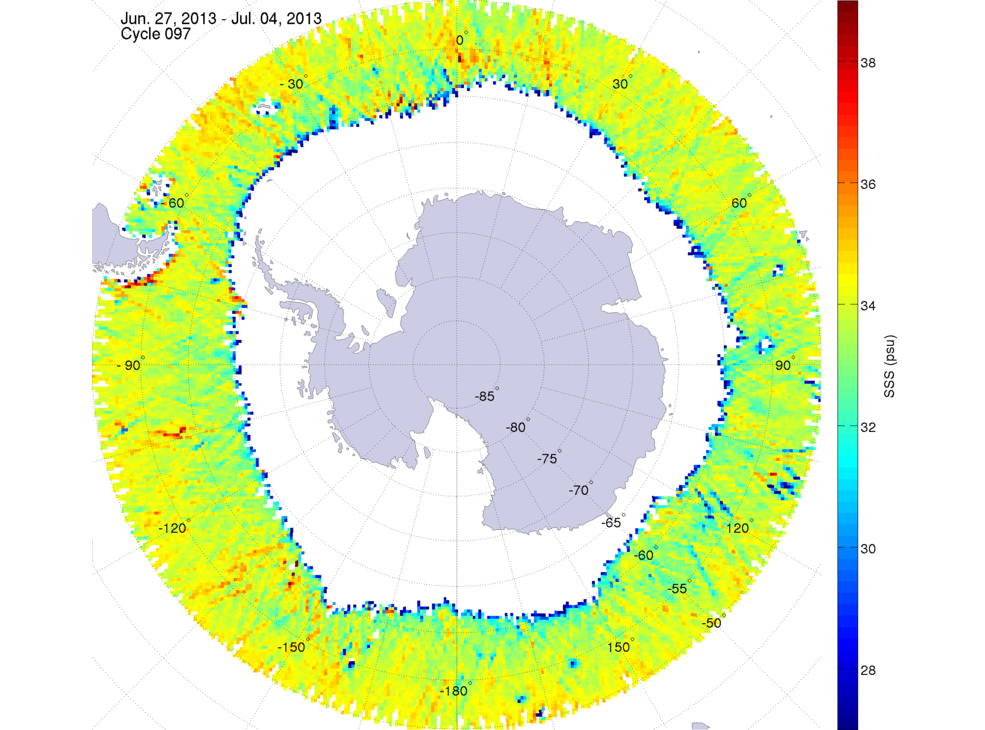 June 27, 2013 | 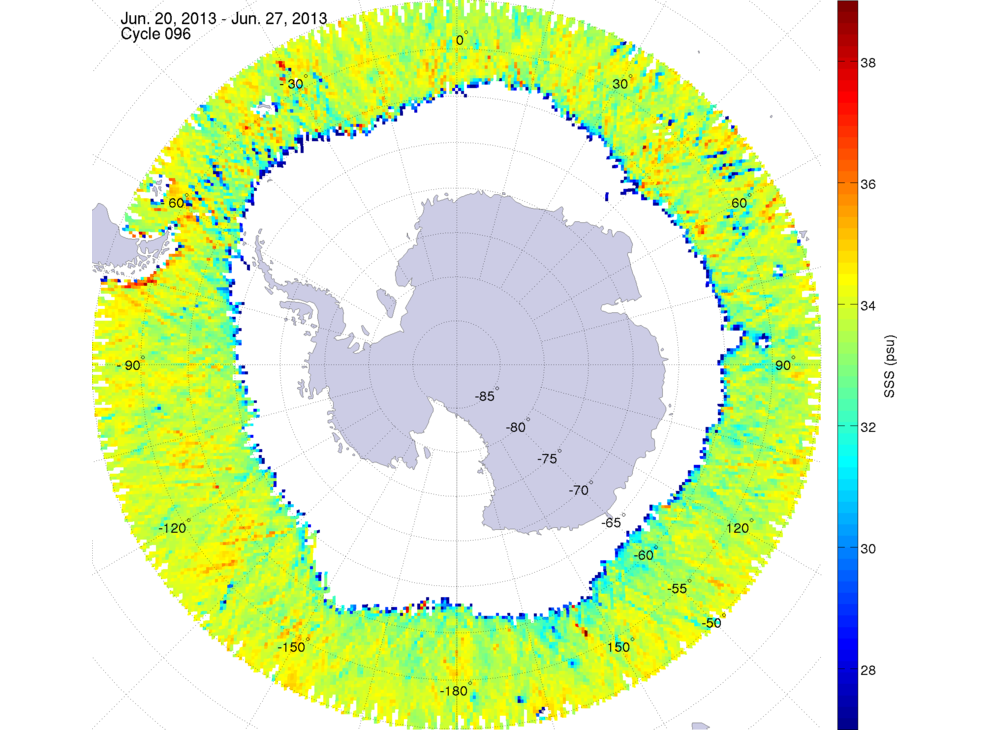 June 20, 2013 | |||
 June 13, 2013 | 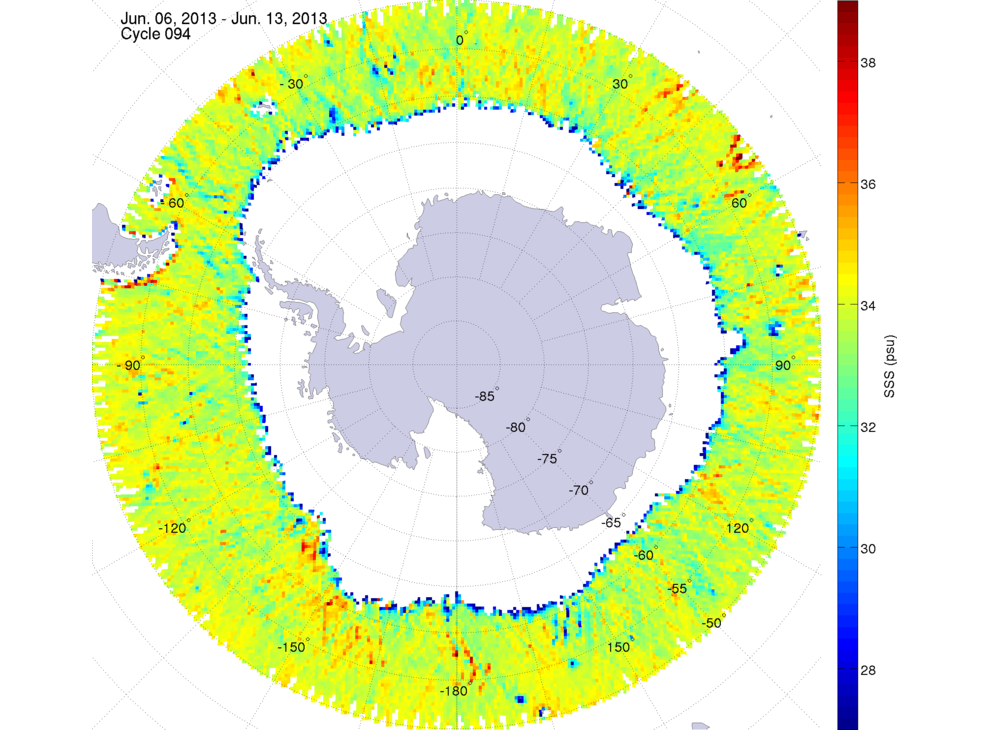 June 6, 2013 | 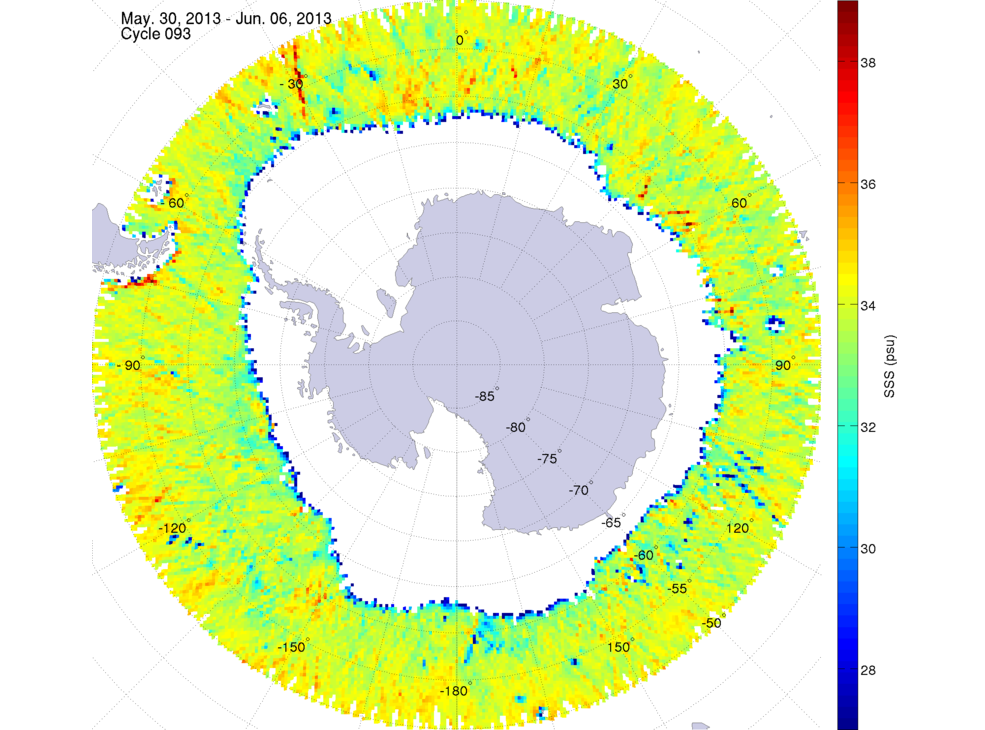 May 30, 2013 | 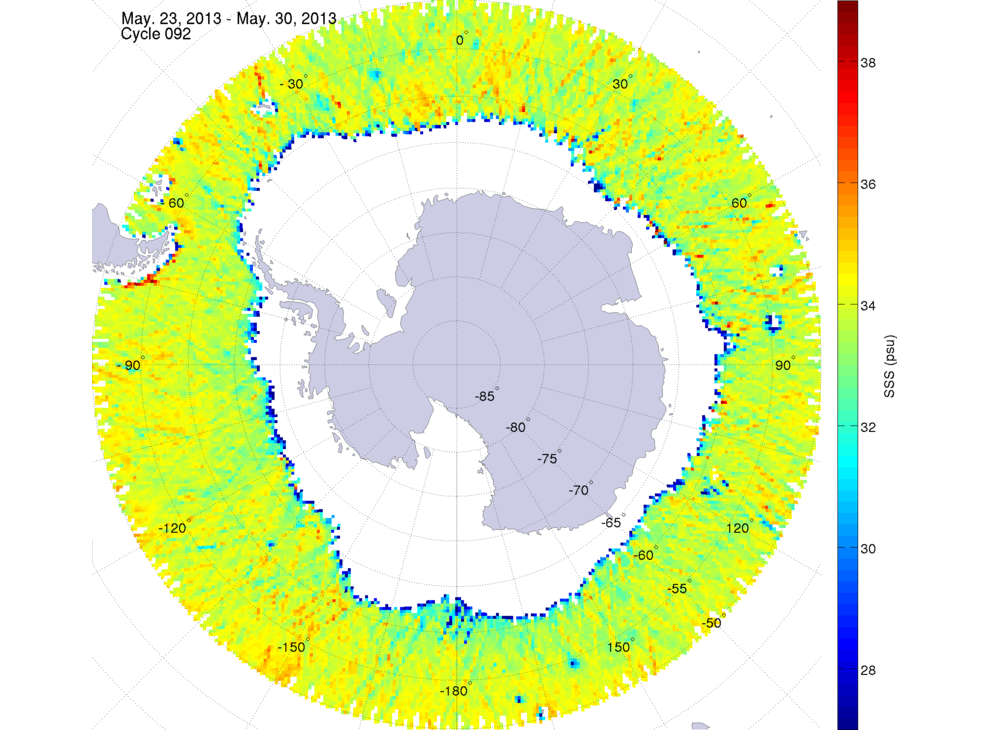 May 23, 2013 | |||
 May 16, 2013 | 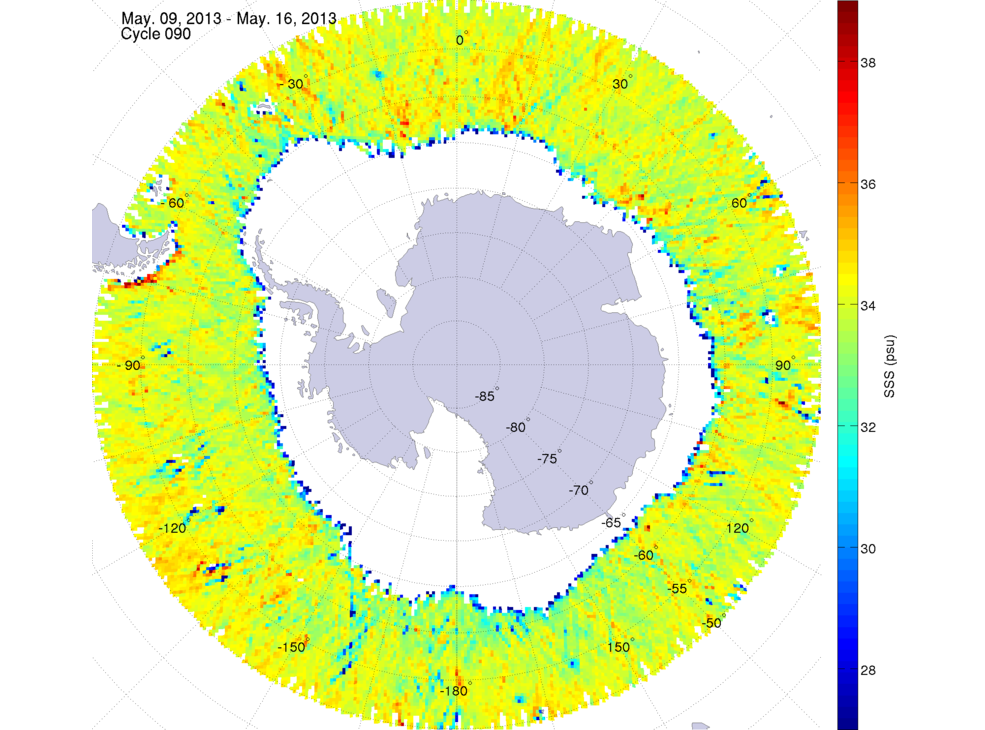 May 9, 2013 | 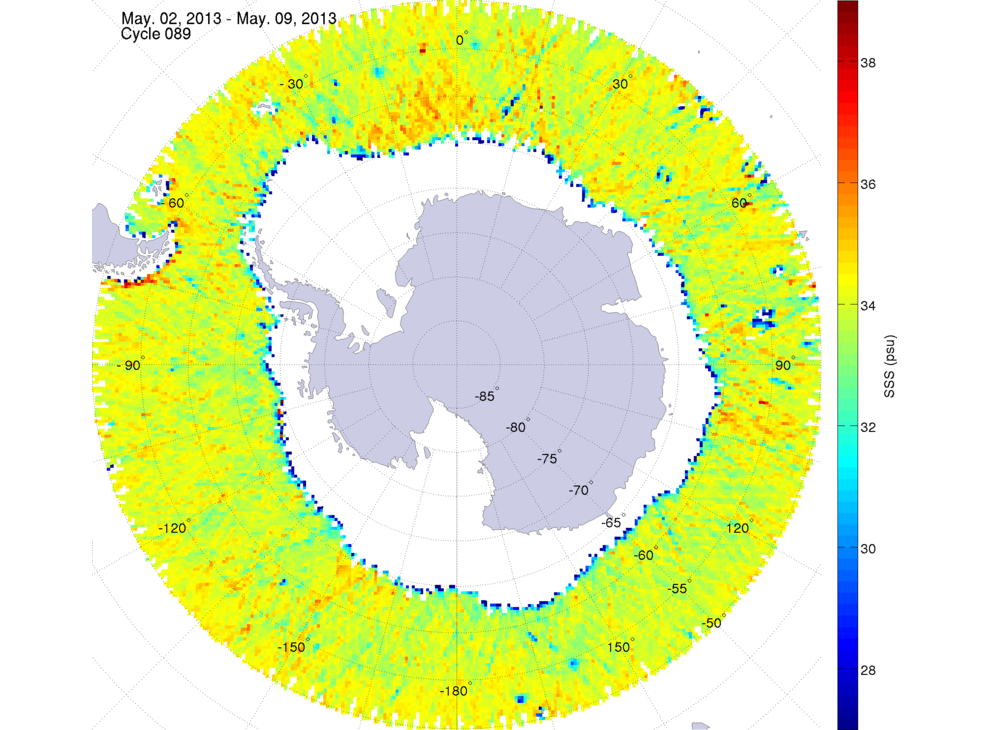 May 2, 2013 | 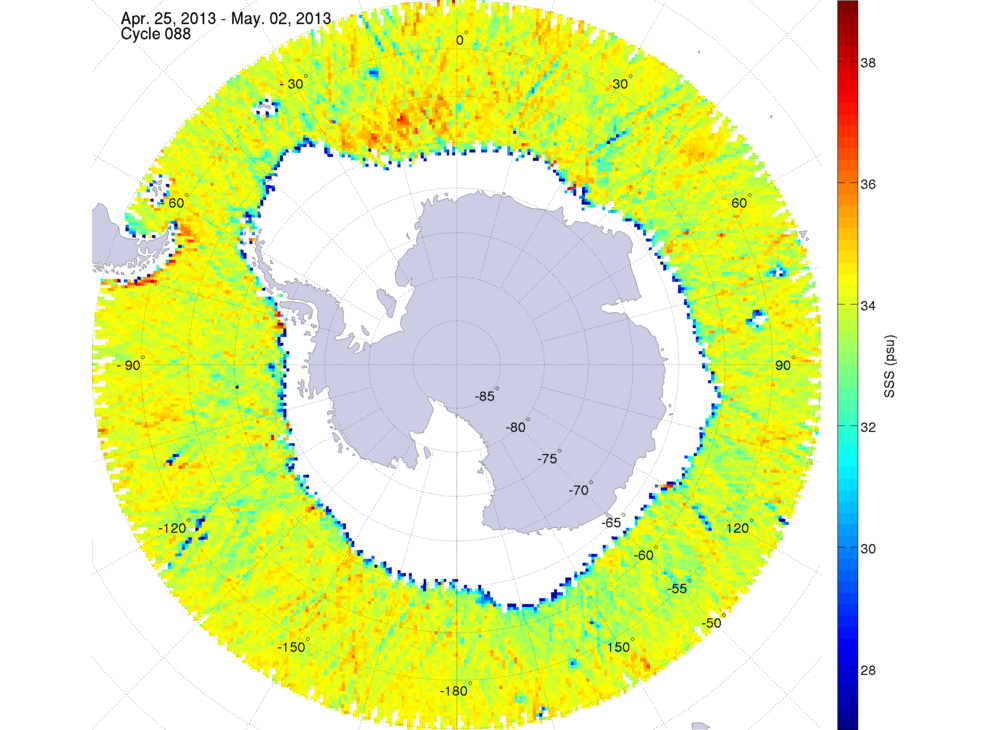 April 25, 2013 | |||
 April 18, 2013 | 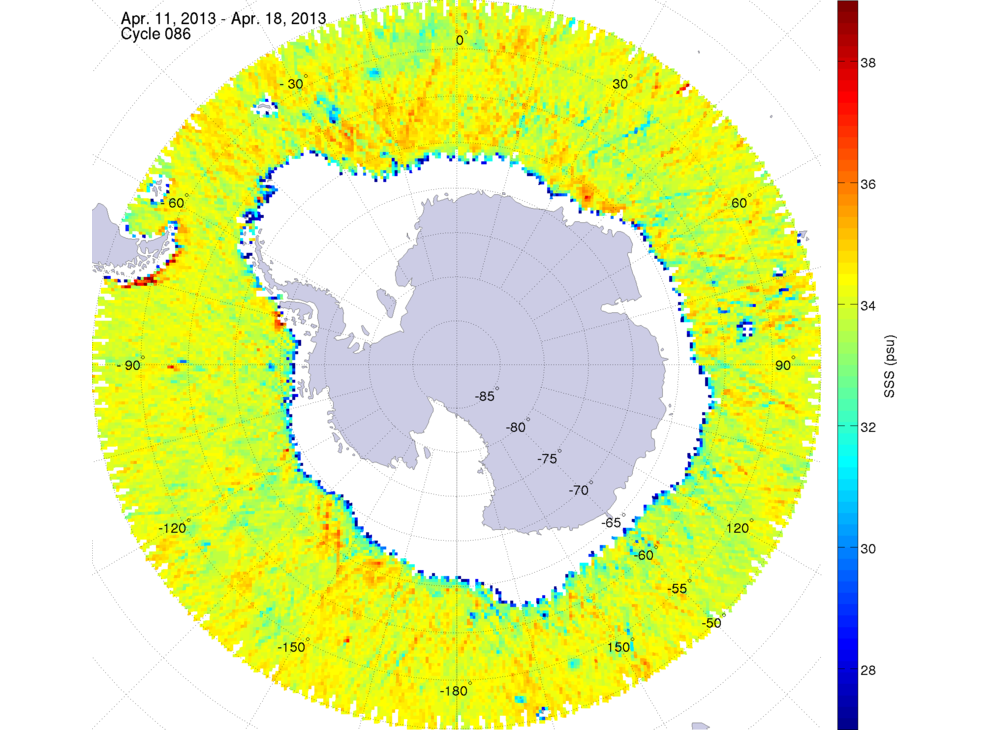 April 11, 2013 | 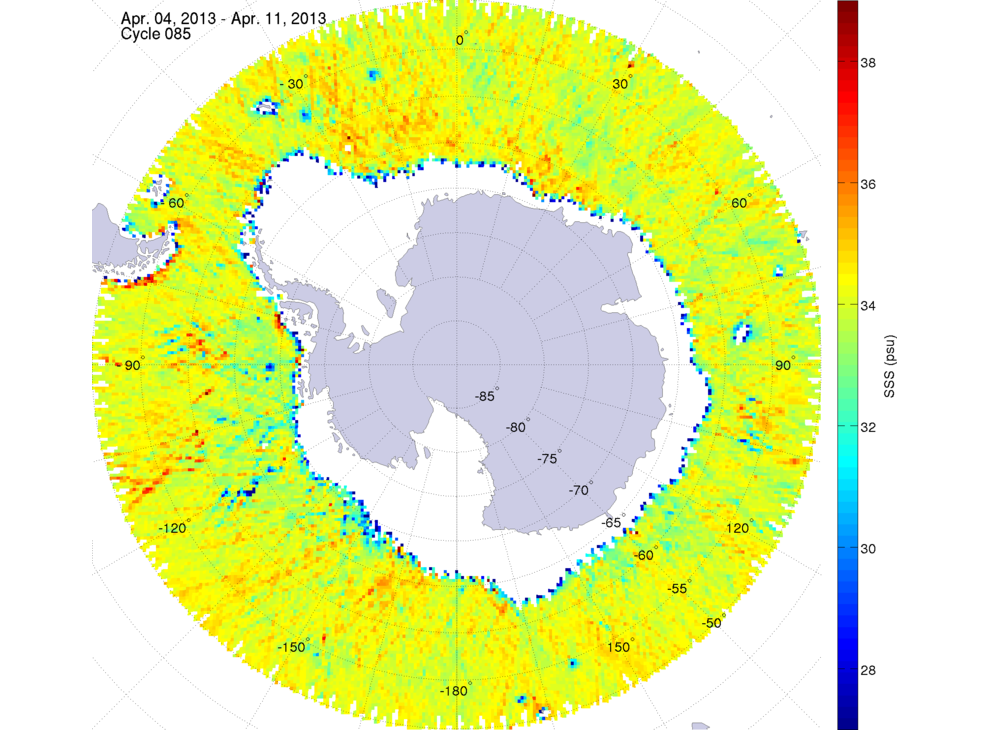 April 4, 2013 | 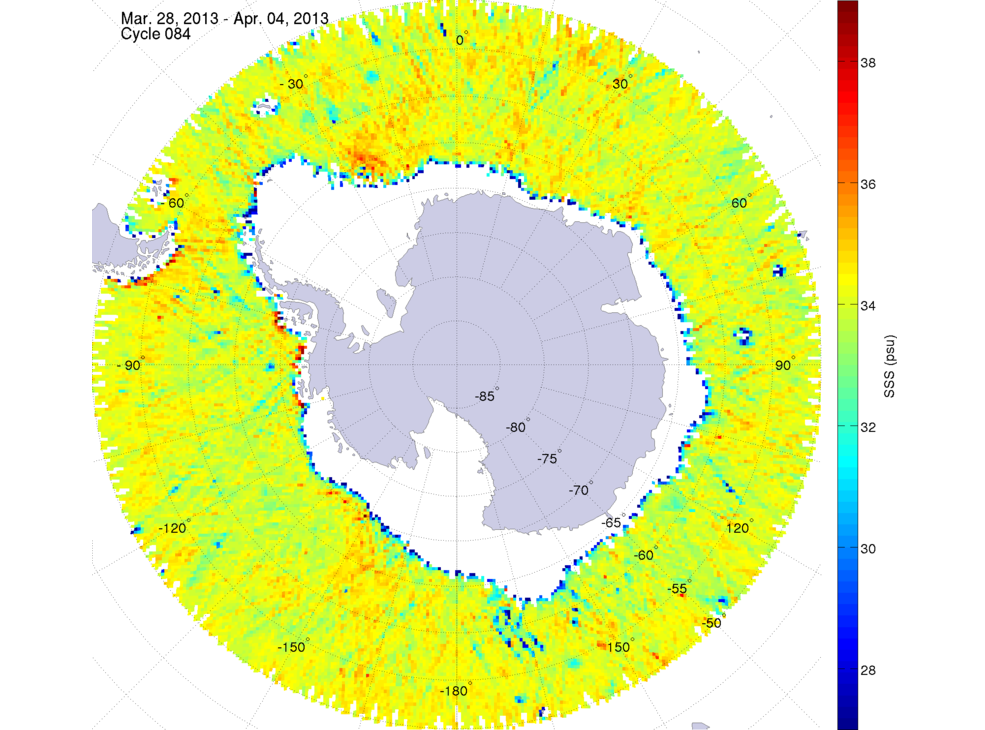 March 28, 2013 | |||
 March 21, 2013 | 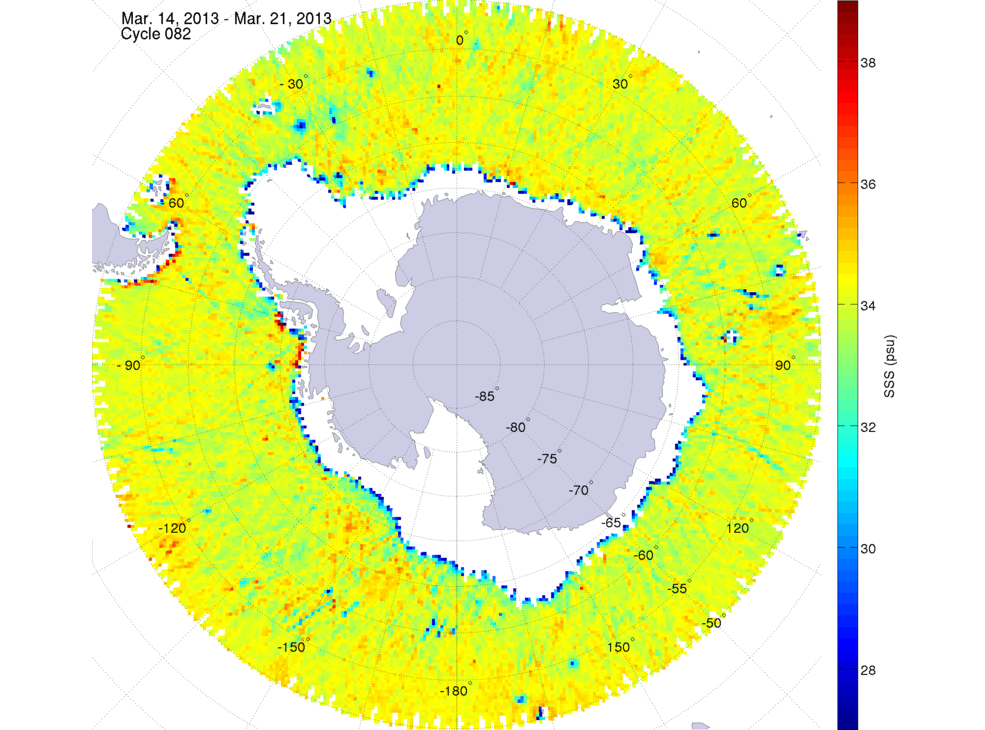 March 14, 2013 | 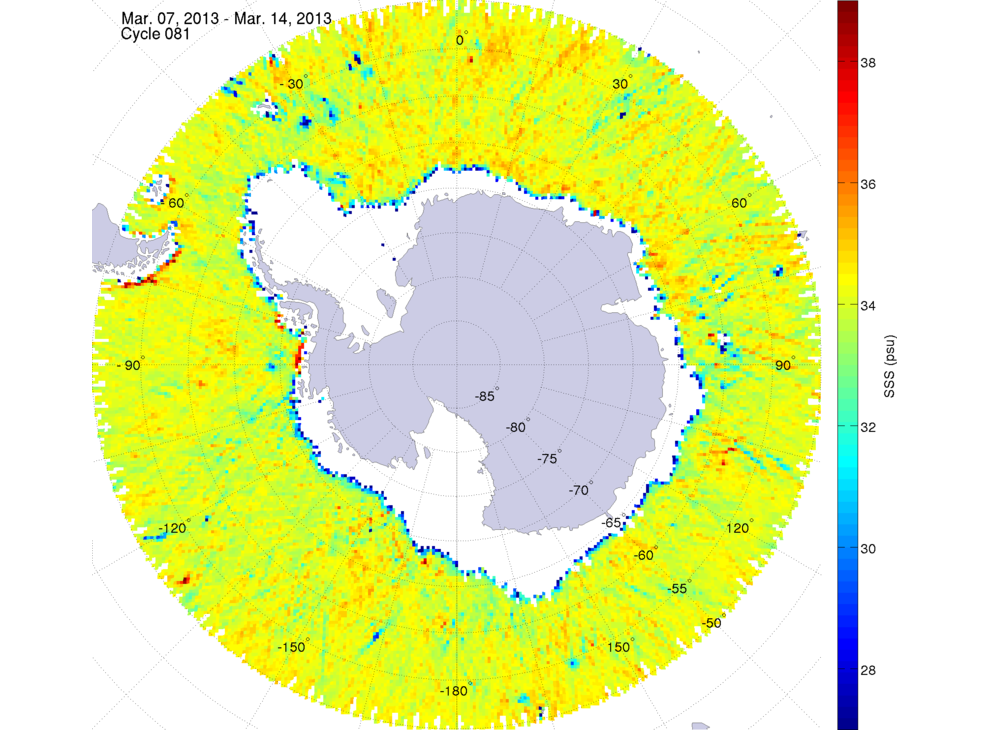 March 7, 2013 | 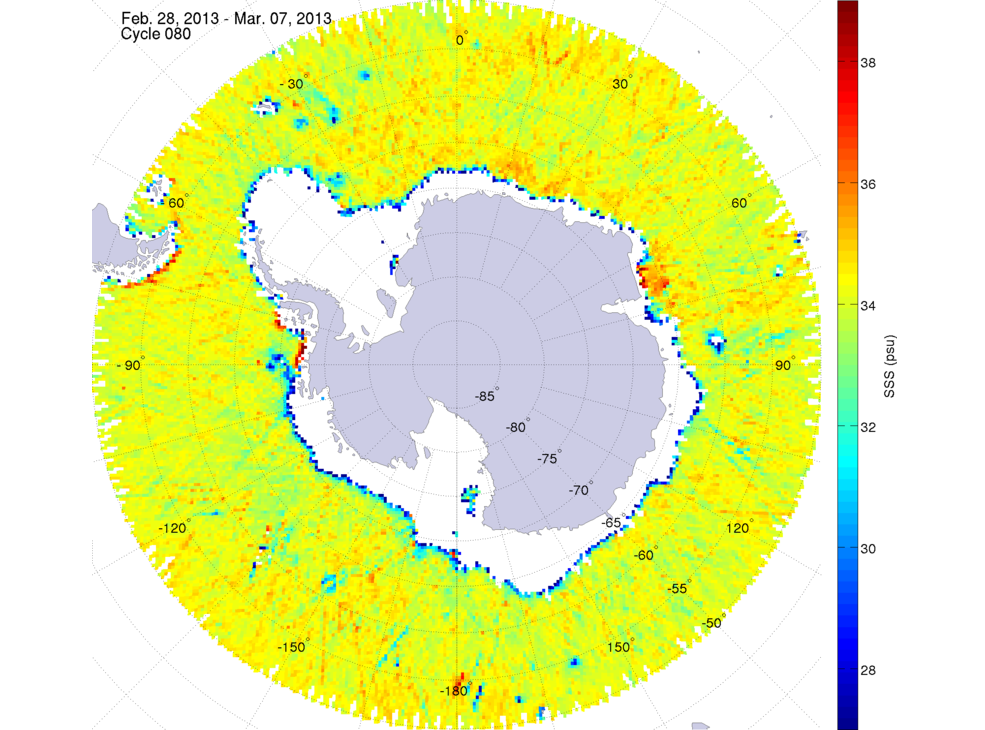 February 28, 2013 | |||
 February 21, 2013 | 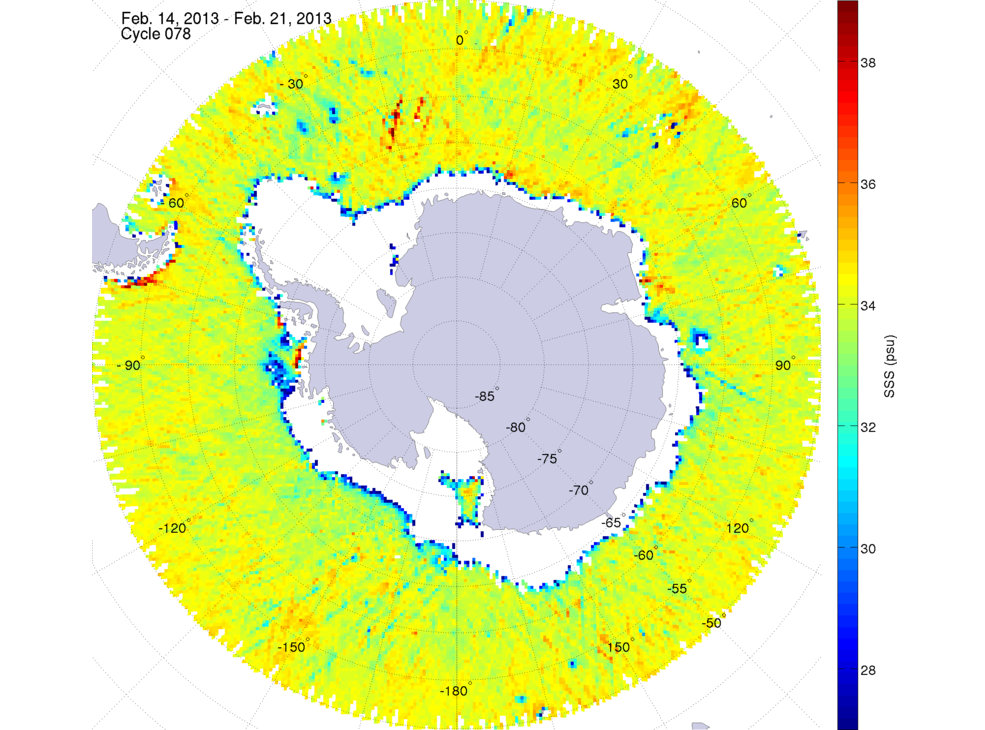 February 14, 2013 | 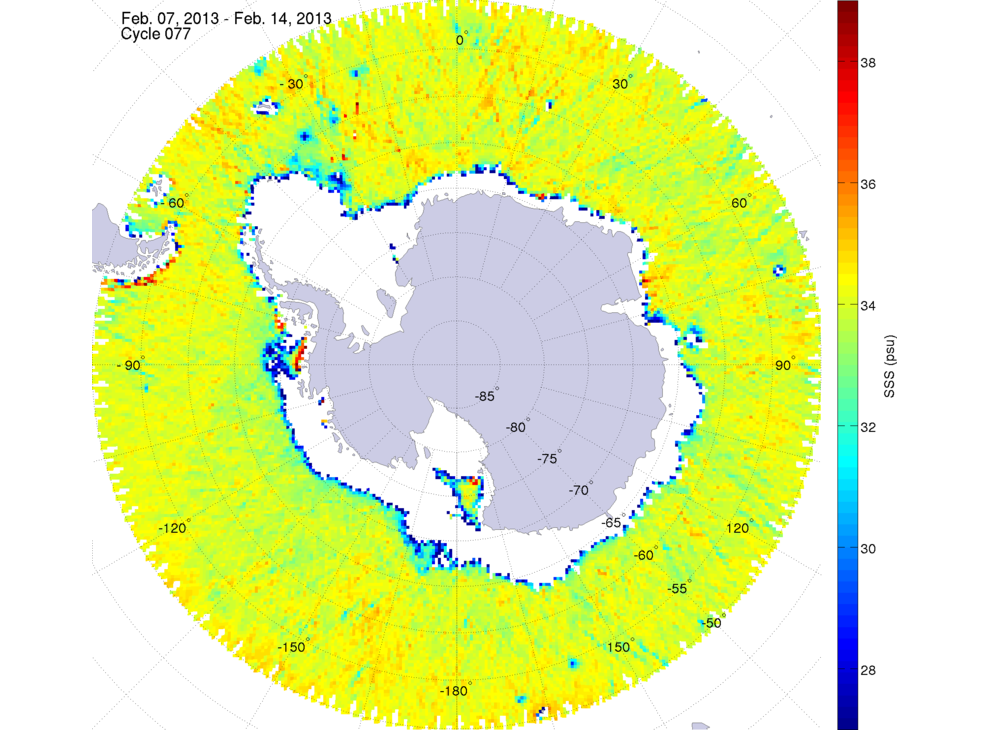 February 7, 2013 | 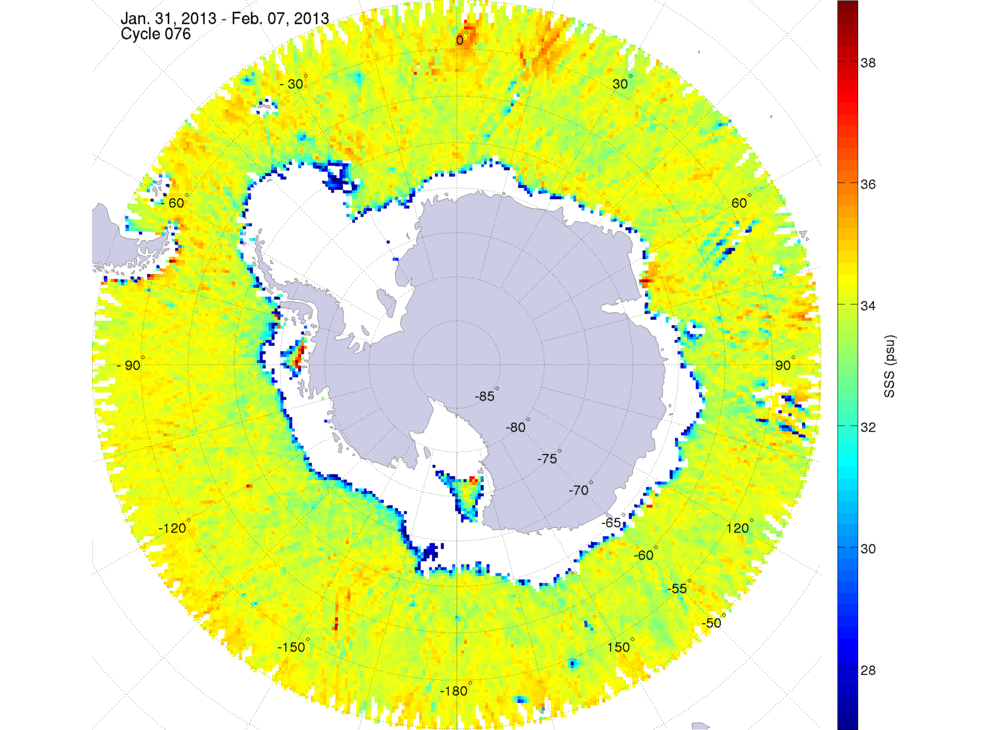 January 31, 2013 | |||
 January 24, 2013 | 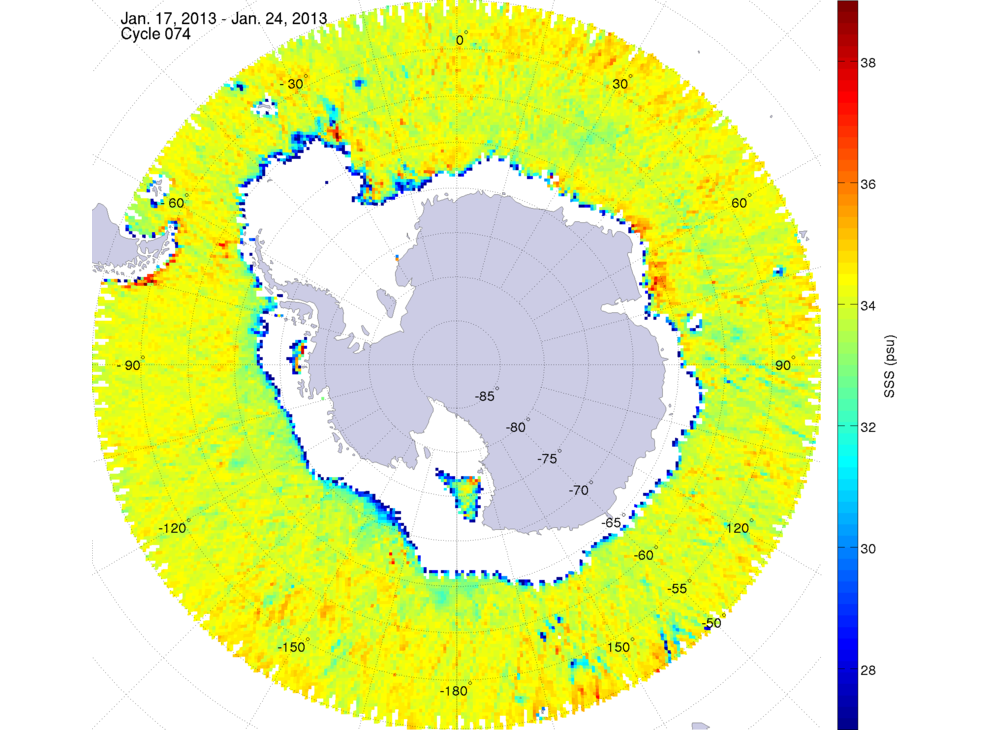 January 17, 2013 | 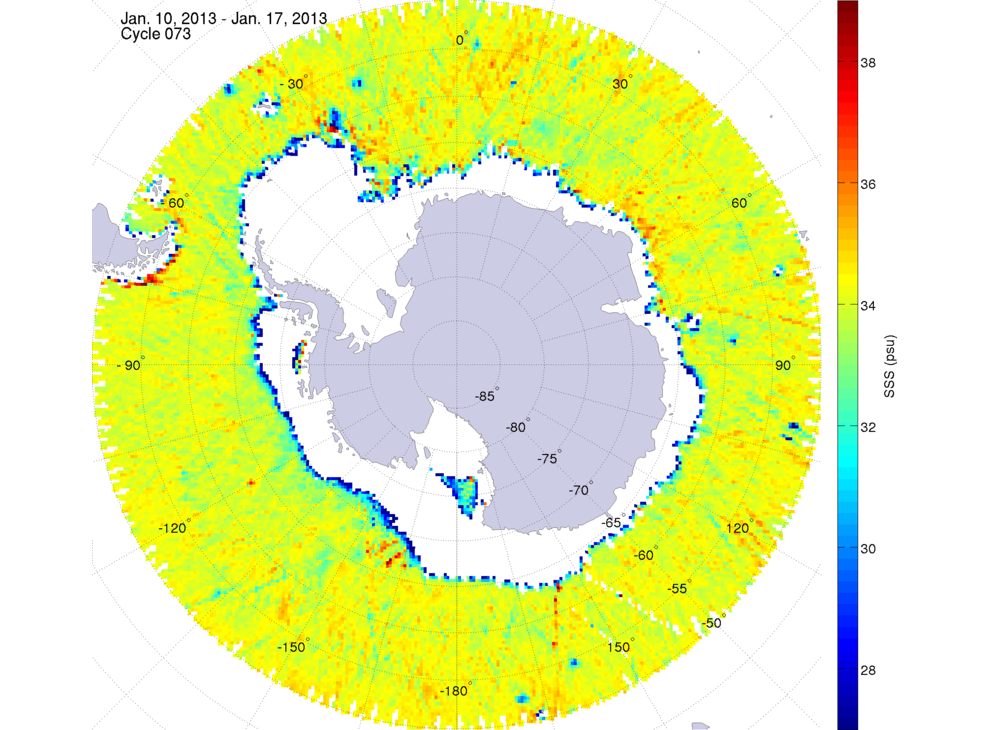 January 10, 2013 | 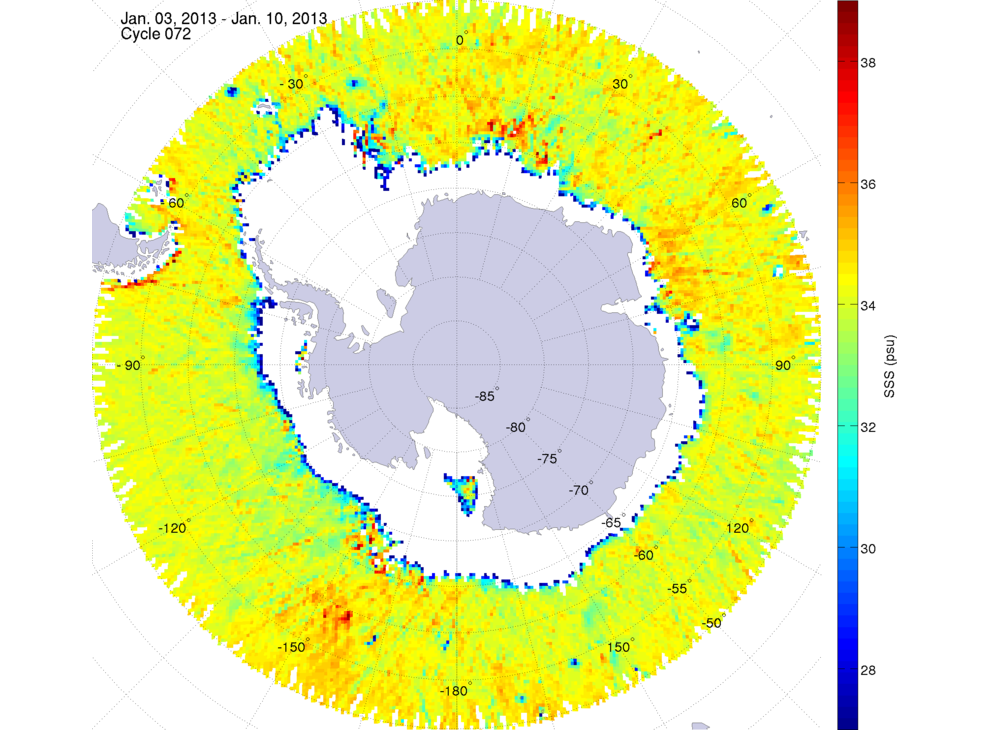 January 3, 2013 | |||
Publications
Brucker, L., Dinnat, E.P., and Koenig, L.S. (2014a). Weekly Gridded Aquarius L-band Radiometer/Scatterometer Observations and Salinity Retrievals Over the Polar Regions - Part 1: Product Description, The Cryosphere, 8, 905-913, doi:10.5194/tc-8-905-2014. Brucker, L., Dinnat, E.P., and Koenig, L.S. (2014b). Weekly Gridded Aquarius L-band Radiometer/Scatterometer Observations and Salinity Retrievals Over the Polar Regions - Part 2: Initial Product Analysis, The Cryosphere, 8, 915-930, doi:10.5194/tc-8-915-2014.
Brucker, L., Dinnat, E.P., Picard, G., and Champollion, N. (2014c). Effect of Snow Surface Metamorphism on Aquarius L-Band Radiometer Observations at Dome C, Antarctica, IEEE Transactions on Geoscience and Remote Sensing, 52 (11), 1-10, doi: 10.1109/TGRS.2014.2312102.