Science Webinars: Mapping Our World With Aquarius/SAC-D
What kind of scientific questions can be addressed with data collected over the ocean from space? On November 22, 2013, three scientists on the Aquarius/SAC mission offered a webinar in Spanish to answer this question.
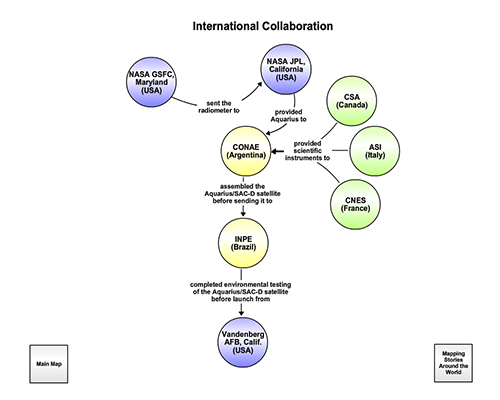
Aquarius/SAC-D - a joint mission between NASA and the National Commission on Space Activities (CONAE) of Argentina - was released on June 10, 2011 from the coast of California, having been built and tested in the United States, Argentina and Brazil. Its main goal was to collect scientific data on the salinity of the oceans, revealing information relevant to ocean circulation, the water cycle and climate. The observatory also included seven scientific instruments and technological packages built by CONAE and the space agencies of France, Italy and Canada.
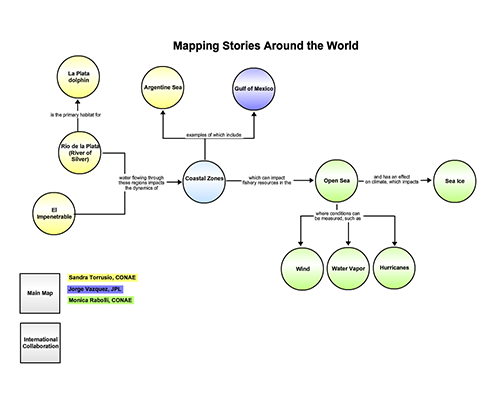
During this webinar, over 85 participants from around the world went behind the scenes of this international mission with Sandra Torrusio, senior researcher at CONAE SAC-D, Monica Rabolli, associate researcher at CONAE SAC-D, and Jorge Vázquez oceanographer at the Jet Propulsion Laboratory of NASA. After describing the process of development and operation of this satellite, the presenters took the audience on a virtual tour highlighting how data from Aquarius/SAC-D can be used to map processes in the ocean and on land - from the forest landscape of El Impenetrable and the habitat of a species of dolphin in danger of extinction all the way to Antarctica!
Concept Maps
This webinar featured several concept maps. Below is the concept map used to organize the presentation. Click on the concepts to access additional resources, or save this map to your CLIMB account by clicking the blue wrench in the upper left corner and selecting "Copy Map to My Maps".The two concept maps presented during the webinar are shown below (click on the images to open these maps). The first concept map shows the contributions from international partners on the mission, the second explores the data that instruments aboard the satellite have gathered, featuring locations around the world.
 |
 |
Resources